Figure 2.
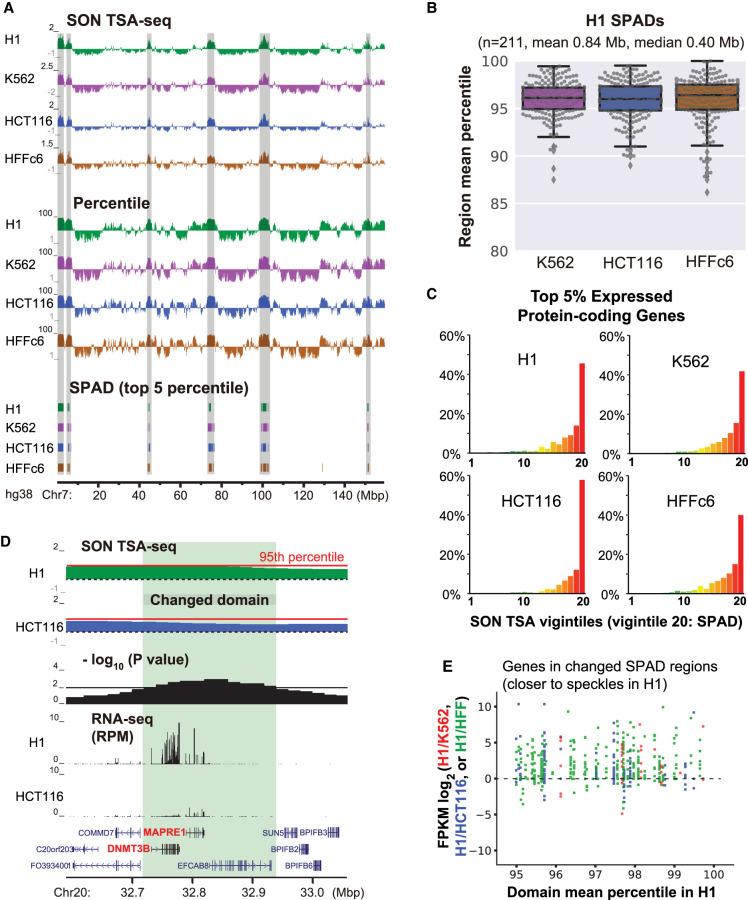
SPADs remain close to nuclear speckles and show high gene expression in all cell lines, yet small position shifts even closer to nuclear speckles correlate with increased gene expression. (A) SON TSA-seq enrichment score (top) and SON TSA-seq signal as a genome-wide percentile score (middle) tracks (20-kb bins), and segmented SPeckle Associated Domains (SPADs) (bottom) in four human cell lines (Chr 7). SPADs were defined as contiguous bins, each with >95th percentile score (Methods). (B) TSA-seq score percentile distributions of H1 SPADs in other three cell lines. Box plots (with data points as dots) show median (inside line), 25th (box bottom) and 75th (box top) percentiles, 75th percentile to highest value within 1.5-fold of box height (top whisker), 25th percentile to lowest value within 1.5-fold of box height (bottom whisker), and outliers (diamonds). (C) Distributions of percentages (y-axis) of top 5% expressed protein-coding genes versus SON TSA-seq vigintiles (division of percentile scores, 1−100, into 20 bins of 5% size each; x-axis) in four cell lines. (D) Top to bottom (light green highlight shows domain repositioned relative to speckles): comparison of H1 and HCT116 smoothed SON TSA-seq enrichment score tracks (black dashed lines: zero value; red solid lines indicate 95th percentiles of TSA-seq enrichment scores), −log10 P-values per bin (significance of change in rescaled SON TSA-seq scores), RNA-seq RPM values, and gene annotation (GENCODE). (E) Expression changes of protein-coding genes in SPADs (in H1) closer to speckles in H1: scatterplots show log2-fold changes in FPKM ratios (y-axis) of H1/K562, H1/HCT116, or H1/HFF versus H1 TSA-seq score percentiles (x-axis).

