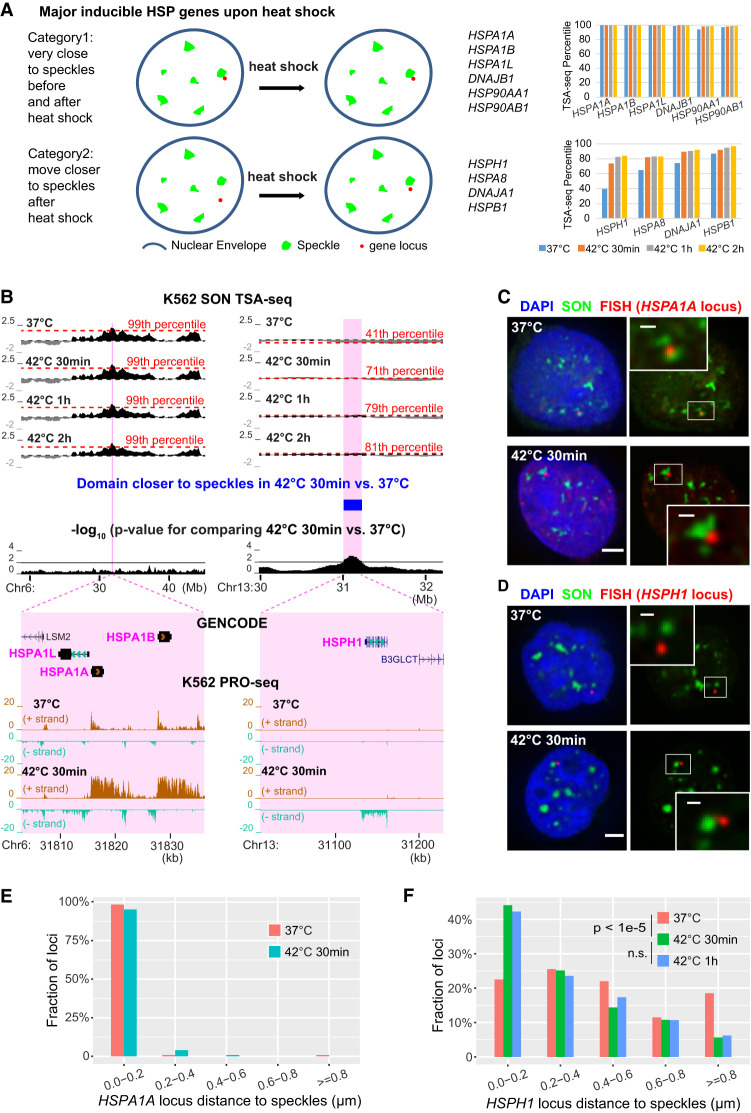
Figure 5.
Approximately half of inducible heat shock protein (HSP) gene loci are prepositioned very close to nuclear speckles in SPADs while remaining gene loci shift closer to speckles after heat shock. (A) Schema (left) and TSA-seq percentiles at 0 (blue), 30 min (orange), 1 h (gray), and 2 h (gold) after heat shock (right) for genes prepositioned near speckles (top) versus those moving closer after heat shock (bottom). (B) TSA-seq and PRO-seq profiles of HSPA1A (left) and HSPH1 (right) loci in K562 cells after heat shock. Top to bottom: smoothed SON TSA-seq enrichment scores for control or heat shock times (red dashed lines: labeled TSA-seq score percentiles; black dashed lines: zero value), significantly changed domains comparing 37°C versus 42°C 30 min (blue rectangular bar, right), −log10 P-values for comparison of rescaled SON TSA-seq scores between 37°C and 30 min heat shock (20-kb bins), and zoomed view of the highlighted two regions (magenta) plus gene annotation (GENCODE) and K562 PRO-seq tracks showing normalized read count (BPM, 50-bp bins). (C,D) 3D immuno-FISH for HSPA1A (red, C) or HSPH1 (red, D) plus SON immunostaining (green) and merged channels with DAPI (blue, left; scale bars: 2 μm) in K562 cells at 37°C (top) or at 42°C for 30 min (bottom). Insets: 3× enlargement of the white-boxed image area (right, scale bars: 0.5 μm). (E,F) Nuclear speckle distance distributions for HSPA1A (E) or HSPH1 (F) FISH signals in control versus after heat shock. HSPA1A: n = 119 (37°C) or 124 (42°C 30 mins). HSPH1: n = 200 (37°C) or 195 (42°C 30 min) or 225 (42°C 1 h), combination of two biological replicates; χ2 test of homogeneity, P = 3.793 × 10⁻⁶ between 37°C and 42°C 30 min, P = 0.9341 (n.s.) between 42°C 30 min and 42°C 1 h.

