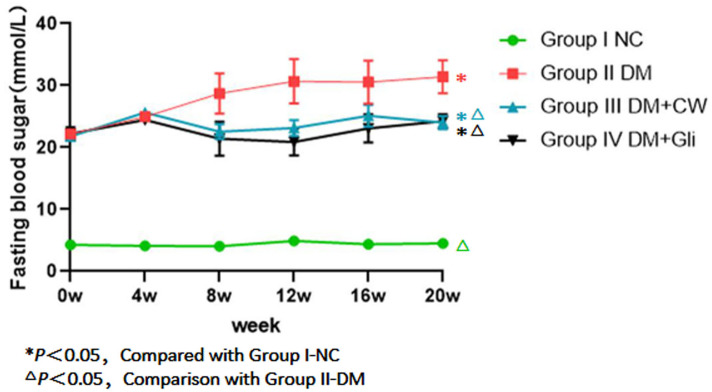
Figure 1. Comparison of fasting blood sugar at different time points in rats of different groups.
Fasting blood glucose (FBG) levels of the group I NC were significantly lower than those of diabetic groups. FBG was gradually increased after the 4-week feeding experiment in group II-DM. Conversely, groups III-DM+CW and IV-DM+Gli showed a trend towards decreasing.

