Figure 5.
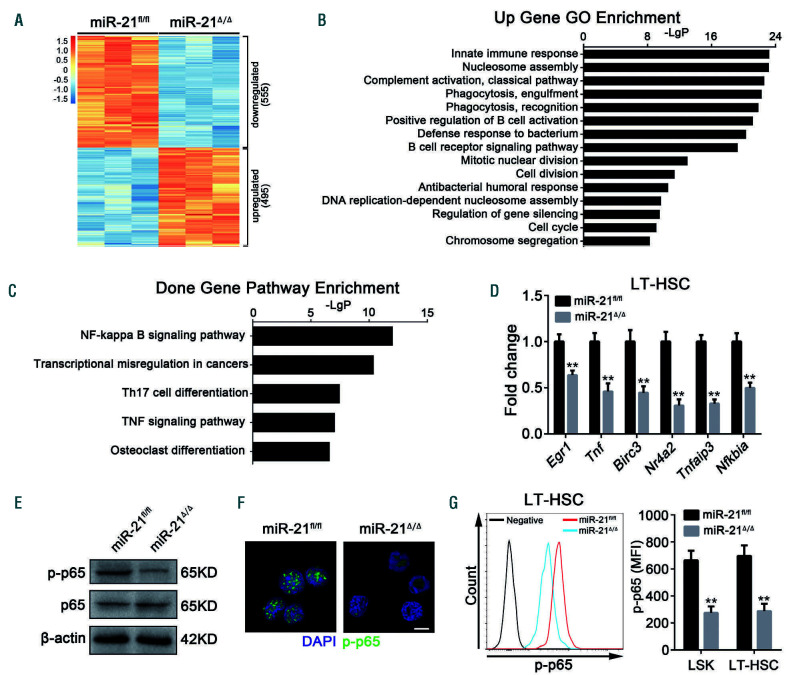
Specific knockout of miR-21 dramatically inhibits the NF-κB pathway in hematopoietic stem cells. (A-C) Lin-Sca1+c-Kit+ (LSK) cells sorted from miR-21Δ/Δ and miR-21fl/fl mice were used for microarray analysis. (A) Heatmap of genes differentially expressed between miR-21fl/fl and miR-21Δ/Δ LSK. (B) Gene Ontology (GO) analysis of genes upregulated in LSK after deletion of miR-21. The data shown are the top 15 enriched GO terms. (C) KEGG pathway analysis of downregulated genes in miR-21Δ/Δ LSK relative to miR-21fl/fl LSK. The top five enriched pathways are shown. The microarray data were gathered from one experiment with three biological replicates. (D) Quantitative real-time polymerase chain reaction analysis of the relative expression of NF-κB target genes (including Egr1, Tnf, Birc3, Nr4a2, Tnfaip3 and Nfkbia) in miR-21fl/fl and miR-21Δ/Δ long-term hematopoietic stem cells (n=3 mice per group). (E, F) The expression of p-p65 in LSK from miR-21fl/fl and miR-21Δ/Δ bone marrow (n=5 mice per group), determined by western blotting (E) and immunofluorescence (F), respectively. DAPI staining indicates the nucleus of cells. Scale bar represents 5 m. (G) Flow cytometric analysis of the expression of p-p65 in LSK and LT-HSC from miR-21fl/fl and miR-21Δ/Δ bone marrow (n=5 mice per group). MFI: mean fluorescence intensity. All data are shown as means ± standard deviation. **P<0.01.

