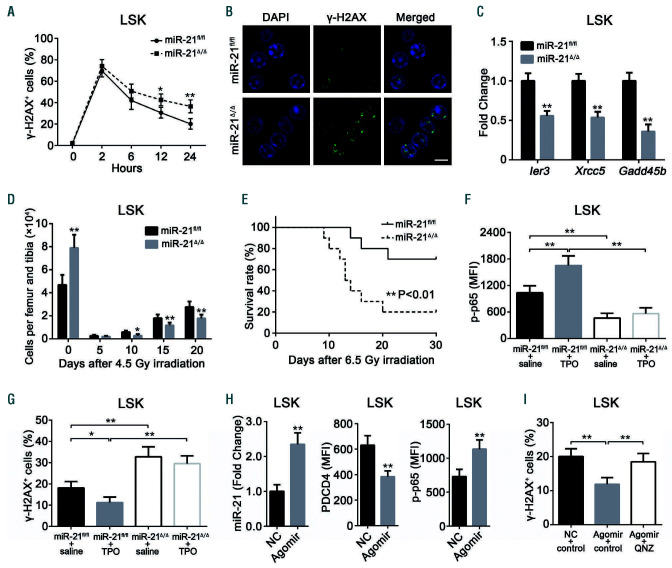
Figure 7.
miR-21 protects hematopoietic stem cells from irradiation-induced damage by activating the NF-B pathway. (A) Flow cytometric analysis of the percentage of -H2AX+ cells at 0 (No irradiation) or 2, 6, 12, 24 h after 4.0 Gy total body irradiation (TBI) (n=6 mice per group). (B) Representative immunofluorescence plots showing the expression of -H2AX in Lin-Sca1+c-Kit+ (LSK) cells from miR-21fl/fl and miR-21Δ/Δ mice 24 h after 4.0 Gy TBI. DAPI staining indicates the nucleus of cells. Scale bar represents 5 m. (C) Quantitative real-time polymerase chain reaction (qRT-PCR) analysis of the relative expression of NF-B target genes (Ier3, Xrcc5 and Gadd45b) in LSK from miR-21fl/fl and miR-21Δ/Δ mice 5 h after 4.0 Gy TBI (n=3 mice per group). (D) The number of LSK in the bone marrow (BM) of miR-21fl/fl and miR- 21Δ/Δ mice after 4.5 Gy TBI (n=6 mice per group). (E) The survival rates of miR-21fl/fl and miR-21Δ/Δ mice after 6.5 Gy TBI (n=10 mice per group). (F, G) miR-21fl/fl and miR-21Δ/Δ mice were treated with saline or thrombopoietin (TPO; 8 μg/kg) 30 min before 4.0 Gy TBI. Then, the expression of p-p65 in LSK was measured 40 min after irradiation (n=6 mice per group) (F), and the percentage of -H2AX+ LSK in these mice was measured by flow cytometry 24 h after irradiation (n=6 mice per group) (G). (H) Normal wild-type mice were treated with three doses of miR-21 agomir or negative control (NC) on consecutive days by tail intravenous injection. Twenty-four hours after the last injection, the relative miR-21 expression in LSK from these mice was detected by qRT-PCR (n=6 mice per group), and the expression of PDCD4 and p-p65 in LSK from these mice was analyzed by flow cytometry (n=6 mice per group). (I) Mice were treated with miR-21 agomir or NC as described before. Twentyone hours after the last injection, mice were intraperitoneally injected with one dose of QNZ or control. Three hours later, mice were subjected to 4.0 Gy TBI. The percentage of -H2AX+ cells in LSK from these mice was detected 24 h after irradiation by flow cytometry (n=6 mice per group). All data are shown as means ± standard deviation. *P<0.05, **P<0.01.

