Figure 2.
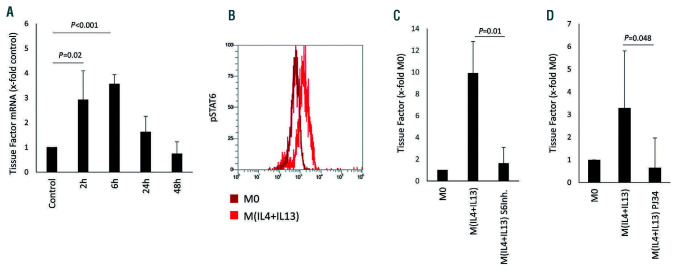
Tissue factor-specific mRNA induction by alternative polarization. (A) Tissue factor (TF) mRNA levels at the indicated time points in macrophages after polarization induced by interleukin (IL)-4 and IL-13 (n=3). (B) Phosphorylated STAT6 as determined in macrophages 30 min after IL-4+IL-13-induced polarization in comparison to that in unpolarized M0 macrophages using flow cytometry and specific antibodies as described in the Methods (n=3). A representative image is shown. (C) TF mRNA levels in macrophages 2 h after IL-4+IL-13-induced polarization in the presence and absence of a specific STAT6-inhibitor (S6Inh.) at 250 mM (n=6). (D) TF mRNA levels in macrophages 2 h after IL-4+IL-13-induced polarization in the presence and absence of the PARP-inhibitor PJ34 at 100 mM (n=6). TF mRNA in panels A, C and D was determined by quantitative polymerase chain reaction and GAPDH was used as a housekeeping gene as indicated in the Methods section. Values are given as fold changes compared to the respective unpolarized control (M0) and represent mean values ± standard deviation.

