Figure 3.
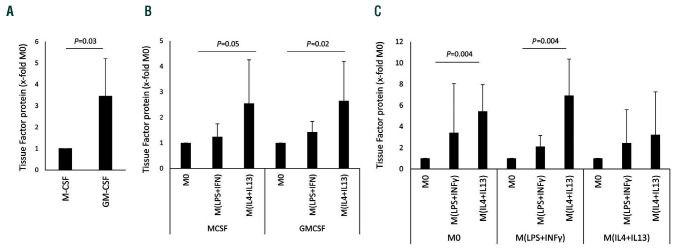
Tissue factor protein induction in different macrophage populations. (A) Tissue factor (TF) protein levels in supernatants from M0 macrophages generated via stimulation with macrophage colony-stimulation factor (MCSF) or granulocyte-macrophage colony-stimulating factor (GMCSF) (n=6). (B) TF protein in supernatants from macrophages that were generated either by stimulation with MCSF or GMCSF and polarized into M(LPS+IFN) and M(IL-4+IL-13) as indicated in the Methods. The respective M0 was used to determine the fold changes induced by the polarization conditions (n=6). (C) Macrophages were polarized for 48 h and afterwards repolarized for 24 h as indicated (n=5). TF protein levels were determined using a specific enzyme-linked immunosorbent assay as indicated in the Methods section. Values are given as fold changes compared to MCSF-differentiated macrophages in panel (A) or the respective unpolarized control (M0) in panels (B) and (C) and represent mean values ± standard deviation. M0: unpolarized macrophages; M(LPS+IFNγ): classically activated polarized macrophages; M(IL-4+IL13): alternatively activated polarized macrophages.

