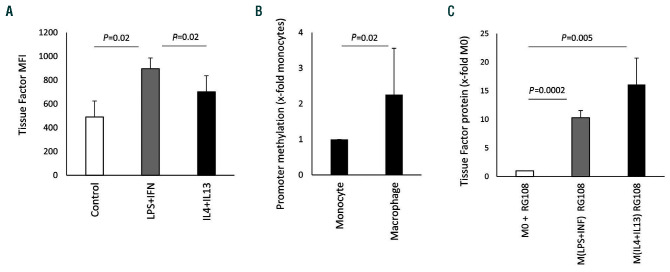
Figure 4.
Epigenetic regulation of tissue factor. (A) Tissue factor (TF) expression on the surface of human monocytes cultured for 24 h in the presence of 100 ng/mL lipopolysaccharide (LPS) and 100 ng/mL interferon (IFN)-γ or 20 ng/mL interleukin (IL)-4 and 20 ng/mL IL-13 or without any addition (control) was analyzed by flow cytometry using a specific antibody as described in the Methods. Data are shown as mean fluorescence intensity (MFI) (n=4). (B) Methylation of the TF-promoter was analyzed by quantitative polymerase chain reaction as indicated in the Methods section. Macrophage values are given as fold increases compared to the monocyte value, which was set at 1. Monocytes and macrophages from the same individuals were compared (n=4). (C) TF protein was determined using a specific enzymelinked immunosorbent assay as indicated in the Methods section in the presence of the demethylating agent RG108 at a concentration of 5 mM during polarization. Values are given as fold changes compared to the respective unpolarized control (M0) (n=3) and represent mean values ± standard deviation. MFI: mean fluorescence intensity; M0: unpolarized macrophages; M(LPS+IFN): classically activated polarized macrophages; M(IL-4+IL13): alternatively activated polarized macrophages.

