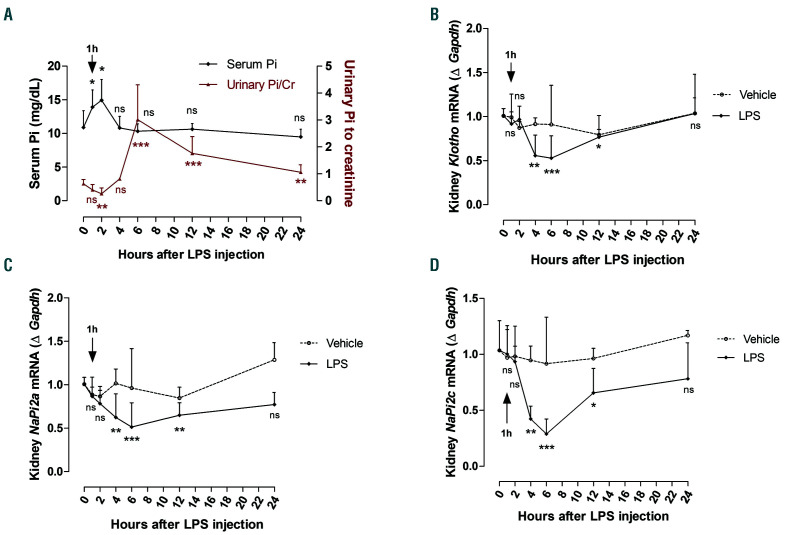
Figure 2.
Regulation of phosphate homeostasis following lipopolysaccharide (LPS) administration. (A) Phosphate levels measured in serum and urine at 0, 1, 2, 4, 6, 12, and 24 hours (h) after i.p. injection of LPS (50 mg/kg). (B-D) Quantitative real-time polymerase chain reaction (qRT-PCR) for renal (B) Klotho, (C) NaPi2a, and (D) NaPi2c expression. Data are expressed as fold change (2-DDCt) relative to housekeeping gene Gapdh. Samples were measured in duplicates (vehicle, n=3-4; LPS, n=5-8). Data are represented as mean+standard deviation. All data were analyzed for normality with Shapiro-Wilk test and equivalence of variance using Levene’s test. For serum Pi, data were analyzed by non-parametric Kruskal-Wallis test; for the ratio of urinary Pi to creatinine, data were aligned in RANK transformation and analyzed with one-way ANOVA followed by Bonferroni’s multiple comparison test (A). With the samples showing normal distribution, two-way ANOVA was performed in each vehicle- or LPS-treated group compared to 0 h with Bonferroni’s multiple comparison test (C). The samples not in normal distribution were analyzed with nonparametric Kruskal-Wallis test (B and D). ns: not significant, *P<0.05, **P<0.01, ***P<0.001 compared to 0 h.

