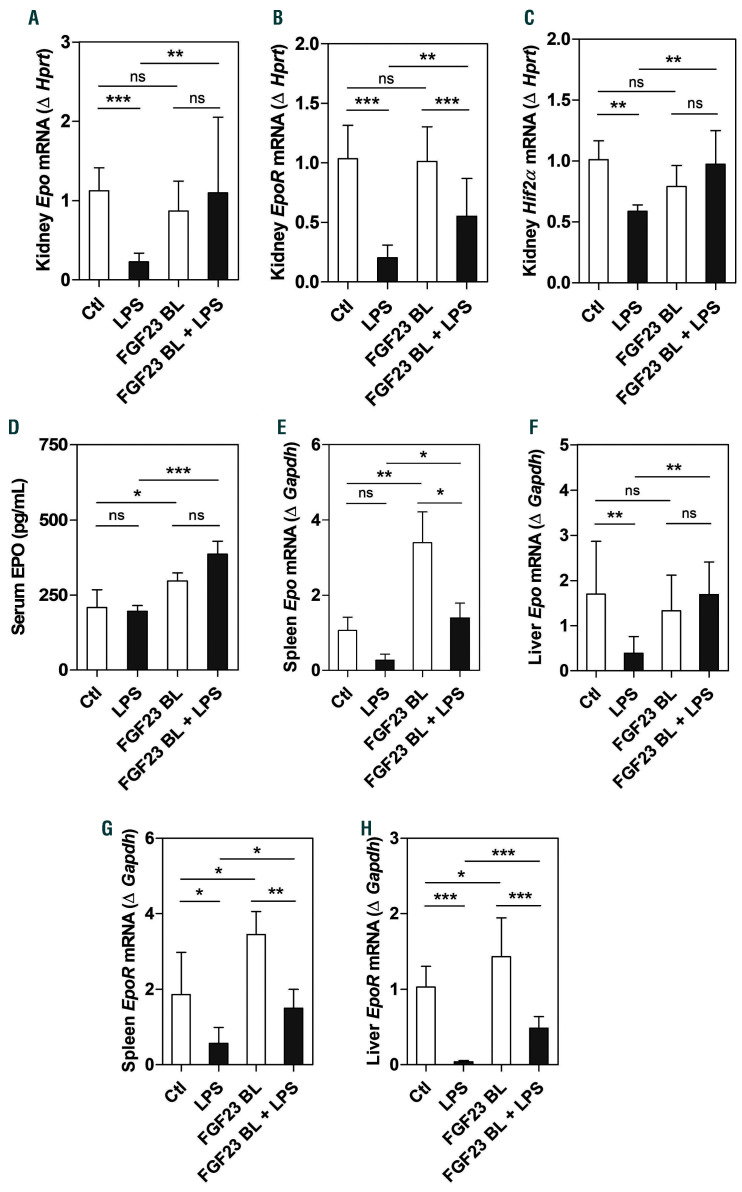
Figure 7.
Inhibition of fibroblast growth factor 23 (FGF23) signaling increases renal and extra-renal EPO and EpoR mRNA expression under lipopolysaccharide (LPS)-induced hypoferremia. C57BL/6J wild-type mice were treated with C-tail FGF23 (1 mg/kg, indicated as FGF23 BL) or vehicle (HEPES buffer) for 8 hours (h). Mice were then challenged with LPS (intraperitoneal 50 mg/kg) or vehicle (0.9% NaCl) for 4 h. (A-C) Quantitative real-time polymerase chain reaction (qRT-PCR) for renal expression of (A) Epo, (B) EpoR, and (C) Hif2α. (D) Serum concentration of Epo measured by ELISA. (E-H) qRT-PCR for Epo expression in (E) spleen and (F) liver, and EpoR expression in (G) spleen and (H) liver. Data are expressed as fold change (2-DDCt) relative to housekeeping genes Gapdh or Hprt. Samples were measured in duplicates (n=5-7 per group). Data are represented as mean+standard deviation. All data were analyzed for normality by Shapiro-Wilk test and equivalence of variance using Levene’s test. When the samples did not show normal distribution, they were aligned in RANK transformation, and confirmed for normality. As the samples showed normal distribution, two-way ANOVA was performed with Bonferroni’s multiple comparison test (B, F, and H). The samples not in normal distribution were analyzed with non-parametric Kruskal-Wallis test (A, C-E, and G). Ctl: control (vehicle), ns: not significant, *P<0.05, **P<0.01, ***P<0.001.

