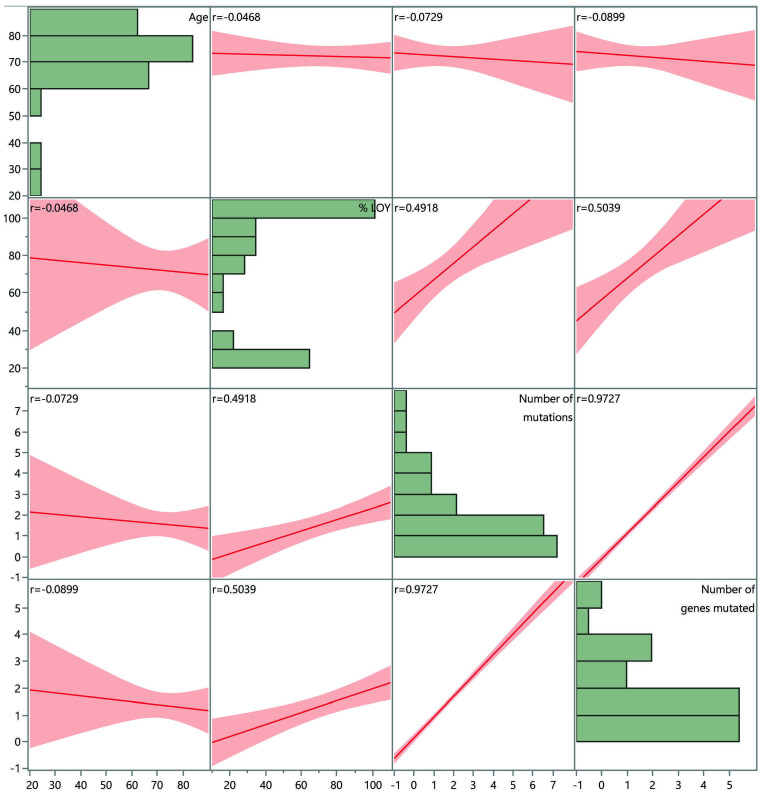
Figure 3.
Percentage of loss of chromosome Y demonstrates positive correlation with total number of mutations as well as number of mutated genes by multivariate analysis. Scatterplot matrix demonstrating correlation between age, percentage of metaphases with loss of chromosome Y, total number of mutations and number of genes mutated. Correlation coefficient for individual correlations provided in each scatterplot. Horizontal bar graphs demonstrating distribution of each parameter is also shown. LOY: loss of Y chromosome.

