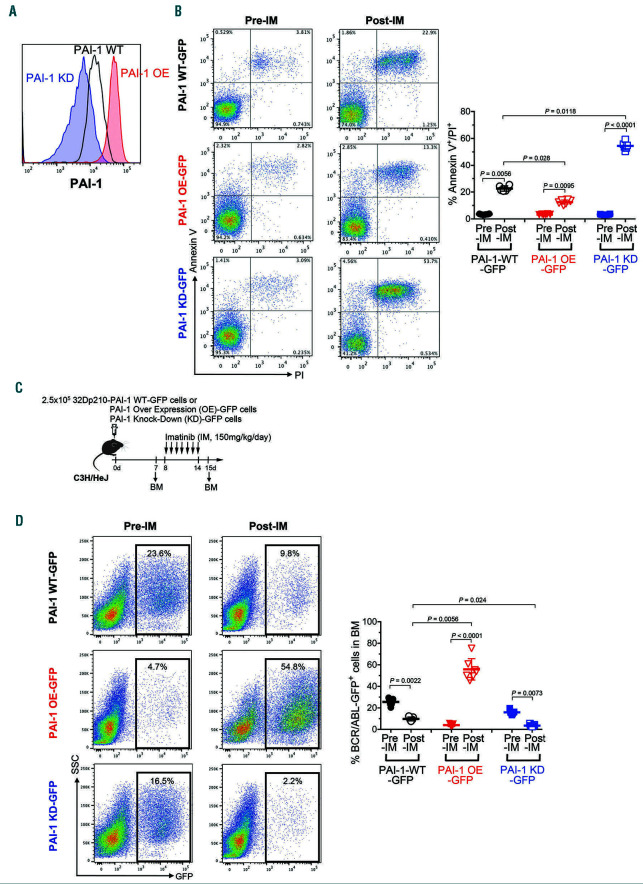
Figure 2.
iPAI-1 protects chronic myeloid leukemia cells from tyrosine kinase inhibitor treatment. (A) A representative flow cytometric profile for intracellular plasminogen activator inhibitor-1 (iPAI-1) expressions in PAI-1-overexpression (PAI-1 OE), PAI-1-knockdown (PAI-1 KD), or wild-type parental 32D p210 cells (PAI-1 WT). (B) Representative flow cytometric profiles and percentage of Annexin V+/PI+ population in PAI-1 OE, PAI-1 KD, or PAI-1 WT cells before imatinib (Pre-IM) and after imatinib (Post-IM) treatment in vitro (n=6). (C) Schema for in vivo experiments. (D) Representative flow cytometric profiles and percentages of leukemic cells in the bone marrow (BM) (n=7). Data represent means ± standard deviation. Statistical significance was determined by Mann-Whitney unpaired t-test. P<0.001, by a Kruskal-Wallis test. GFP: green fluorescent protein.

