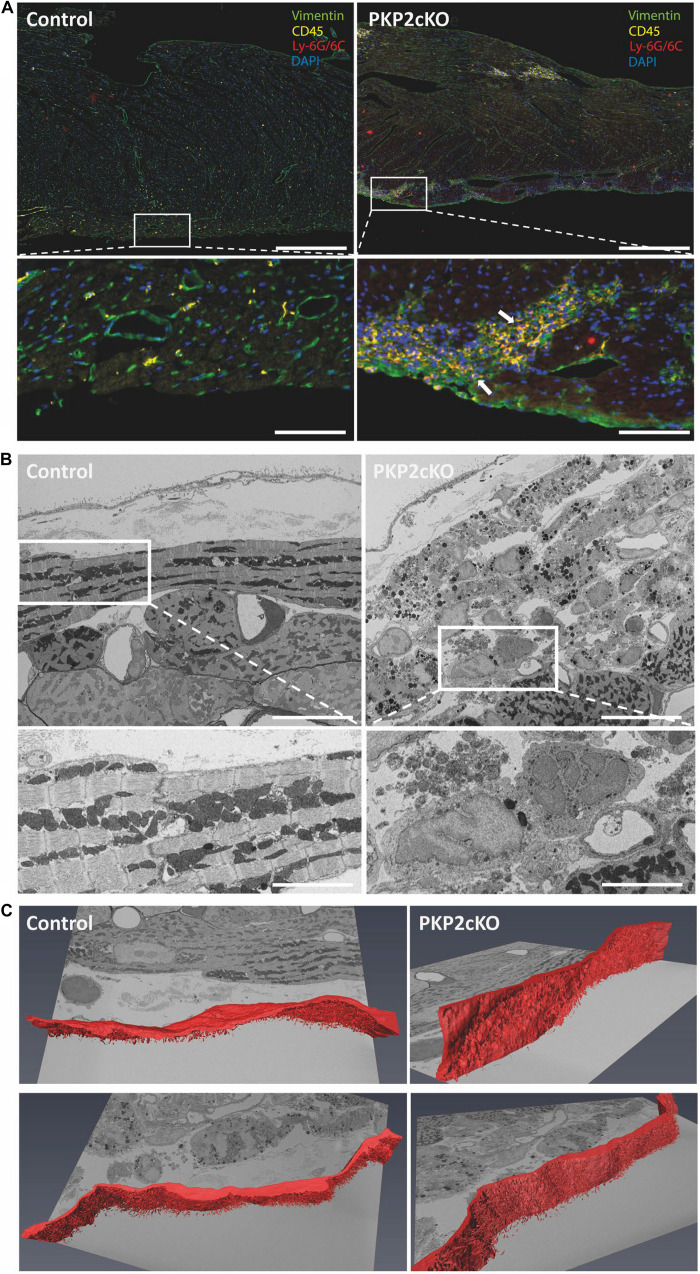
FIGURE 3.
Non-myocyte cell infiltration in ventricular tissue of wildtype and PKP2cKO mice. (A) Opal Multiplex immunohistochemistry staining for vimentin (green), CD45 (yellow), Ly-6G/Ly-6C (red), and DAPI (blue) in control and PKP2cKO ventricular tissue 21 days post-tamoxifen injection (dpi). Scale bar = 200 μm. White insets depict zoomed-in view; arrows highlight infiltration of CD45 and Ly-6G/6C-positive cells in PKP2cKO subepicardium. Scale bar = 50 μm. (B) Serial block face scanning electron microscopy (SBF-SEM) images of control (left) and PKP2cKO (right) subepicardial ventricular tissue, 14 dpi. Upper left panel (control), top to bottom: pericardial space; epicardial cell layer; basal membrane; first myocytes aligned parallel to epicardial surface. In right panel (PKP2cKO), see abundance of subepicardial non-myocyte cells and injured myocytes. A first layer of “healthy” myocytes is seen in bottom right corner. Scale bar = 10 μm. White frames indicate areas enlarged in bottom. Scale bar = 5 μm. (C) Single frames of complete z-stack of SBF-SEM images, with segmentation analysis of epicardial layer (red). Complete stack is in Supplementary Movies.

