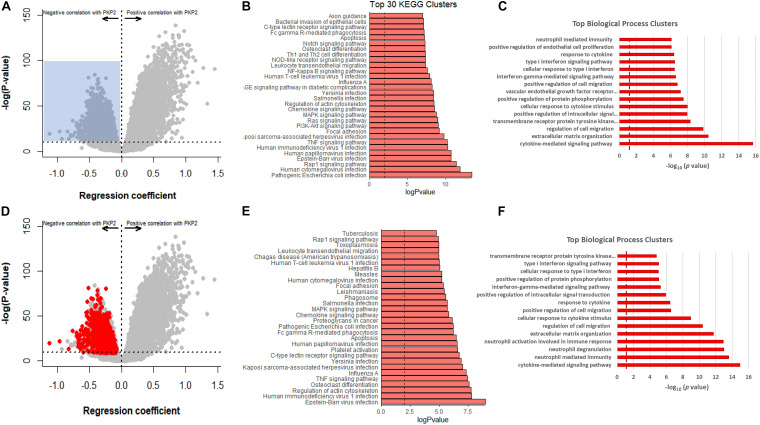
FIGURE 5.
GTEx-based PKP2 transcript correlation analysis, in comparison to RNA-seq PKP2cKO/RiboTag. (A) Correlation analysis of PKP2 normalized transcript abundance against other transcripts in the GTEx left ventricle database. Dots in gray are the same as in Figure 4E. Blue shadow indicates area selected for pathway analysis (regression coefficient < −0.5 and p-adjusted > 1E-10. (B,C) Top 30 Kyoto Encyclopedia of Genes and Genomes (KEGG) pathways and biological process analysis, respectively, of transcripts inversely correlated with PKP2. (D) Same plot as (A) but red circles indicate 912 transcripts significantly upregulated in RiboTag RNA-seq dataset. (E,F) Top 30 KEGG pathways and biological process analysis of red transcripts.

