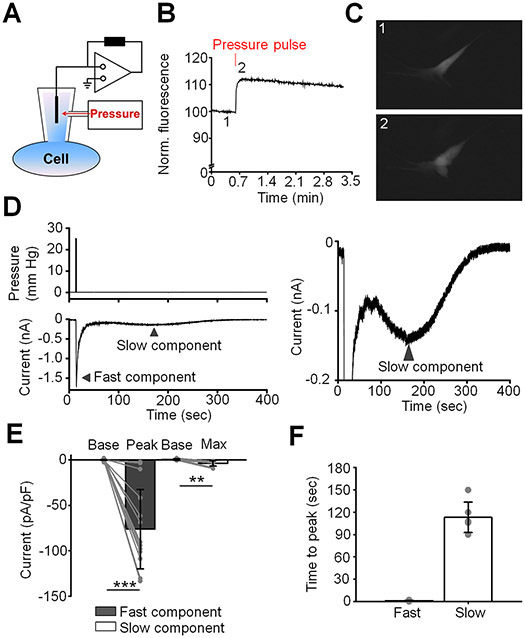
Figure 1. Two kinetically distinct components of pressure-induced current.
(A) Schematic diagram of the setup. (B) A representative trace of calcein fluorescence illustrating effect of pressure pulse. Positive changes in fluorescence indicate at an increase in cell volume. (C) A representative fluorescent image demonstrating change in cell volume after application of a pressure pulse. Images were taken at the corresponding time points shown in (B). (D) A representative trace illustrating the fast and the slow components (lower trace) of the response to pressure (upper trace). The right panel is the Y-axis expansion of the trace shown in the left panel. The holding potential was −40 mV. (E) Quantification of the magnitude of the fast and the slow responses. Shown are the means ± SD of baseline current (base) measured before application of the pressure pulse and the current measured at the peak and the maximum of the fast and the slow components, respectively. The gray symbols indicate individual values. **p = 0.0033, ***p < 0.00001, paired-sample t-test; N = 2 different donors’ eyes, n = 15 and n = 9 cells for the fast and the slow components, respectively. (F) Bar graphs summarizing kinetics of fast and slow components. Results obtained from cells isolated from two different donors’ eyes were pooled. Shown is the mean ± SD of time measured between application of the pressure pulse and when current reaches the maximum value. Grey symbols represent individual values. n = 17 cells and n = 6 cells for fast and slow response, respectively.

