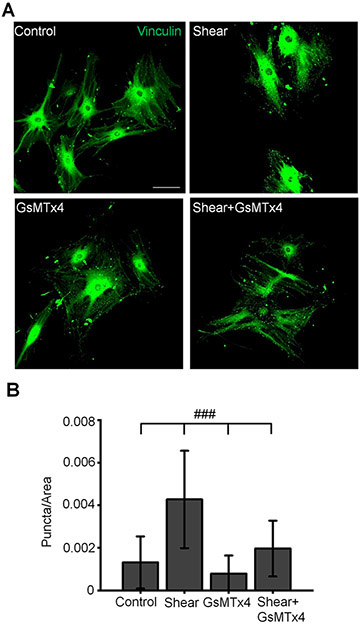
Figure 12. Shear stress-induced reorganization of focal adhesions require the activity of Piezo1.
(A) Representative examples of TM cells immunolabeled for vinculin. Scale bar is 50 μm. (B) Bar graphs summarizing effects of shear stress and GsMTx4 on a number of vocal adhesions. ###p < 0.00001; n = 112, 120, 120 and 108 cells for control, shear, GsMTx4, and shear+GsMTx4 groups, respectively. ANOVA multiple comparisons test, Tukey’s test was applied for means comparison, R-Square = 45 %. Shown are the mean ± SD. GsMTx4 (5 μM) was added to the perfusing solution 5 min prior to shear stress.

