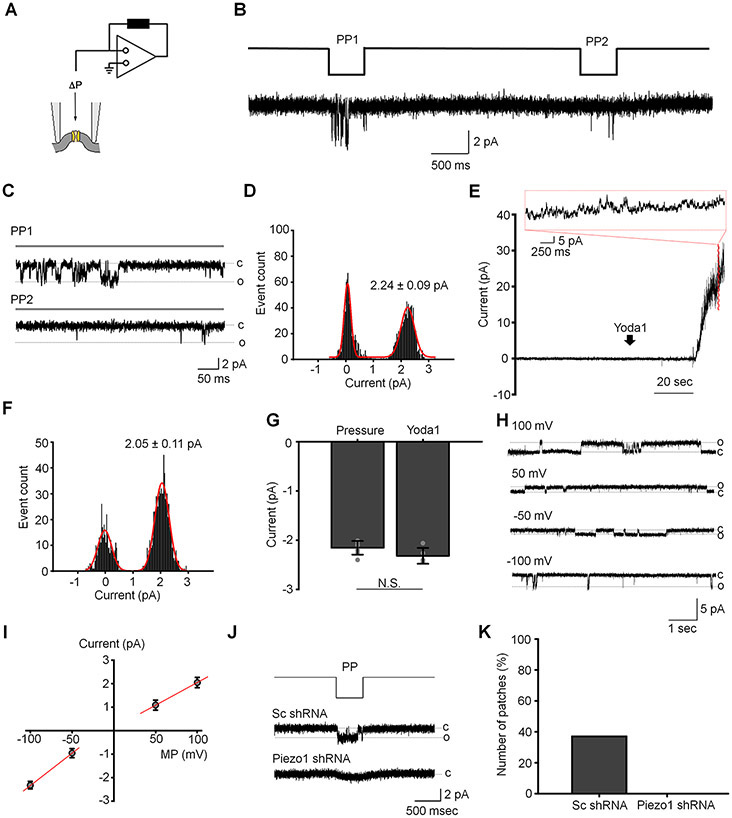
Figure 3. Activity of Piezo1-like channel in TM cells.
(A) A schematic of the inside-out patch clamp configuration. Negative pressure (ΔP) was delivered through the patch pipette. (B) A duplet pressure pulse (−80 mm Hg, 500 ms) triggered the activity of a rapid activating and inactivating channel in excised inside-out plasma membrane patches. (C) Expanded traces of single channel activity recorded during the first (PP1) and the second (PP2) pressure pulse application. The trace is an extract of the trace shown in B. Dashed lines indicate closed (c) and open (o) states of the channel. (D) A representative histogram of unitary current amplitude of the pressure-activated channel. The solid red line is a fitting of the Gaussian equation through the experimental data (χ2 18.24, degrees of freedom = 121, R-Square (COD) = 93%). The current amplitude of the closed levels is 0.063 ± 0.055 pA. The bin-width is 0.03 pA and sampling time 8 sec. The membrane potential was −100 mV. (E) A representative recording illustrating induction of multiple channel activity by Yoda1 (10 μM). The insert shown above the trace is an expansion of the outlined extract. The membrane potential was 100 mV. (F) A representative histogram of unitary current amplitude of the channel activated by Yoda1. The solid line is a fitting of the Gaussian equation through the experimental data (χ2 = 8.19, degrees of freedom = 115, R-Square (COD) = 93%). The bin-width is 0.03 pA. The current amplitude of the closed levels is −0.023 ± 0.18 pA. The membrane potential was −100 mV. (G) The comparative analysis of the amplitude of pressure- and Yoda1-induced current recorded at the membrane potential −100 mV. Shown are the mean ± SD. N.S.p = 0.08. Two-sample t-test; n = 7 and 5 patches, respectively. (H) Original registrations of Yoda1-induced single channel activity at different membrane potentials. (I) The I-V relations for the Yoda1-induced single channel current. Shown are the mean ± SD (symbols) and linear regression through the data (solid red lines). (J) Occurrence of the Piezo1-like channel reduced in cells overexpressing Piezo1 shRNA compared to control cells overexpressing scramble shRNA. Shown are representative current traces. (K) Quantification of the effect of Piezo1 knockdown on the occurrence of Piezo1-like channel. The membrane potential was −100 mV.

