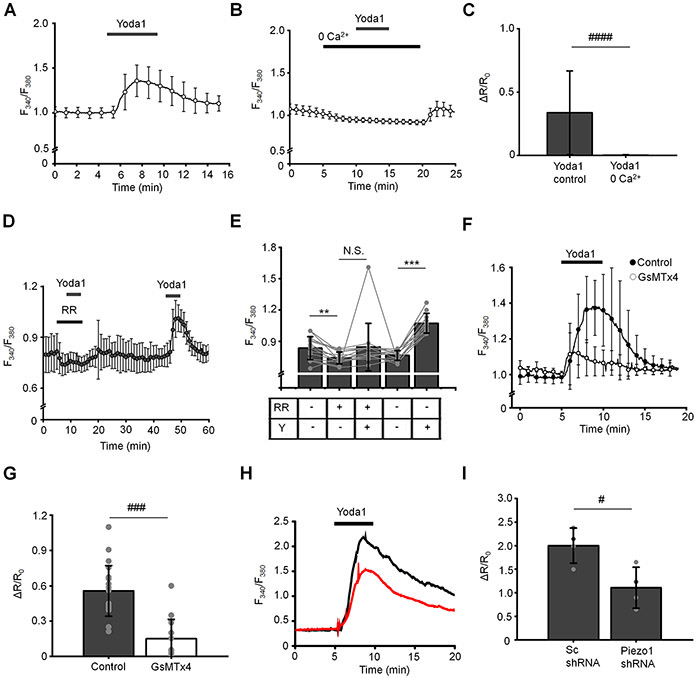
Figure 8. Activity of Piezo1 is functionally coupled to elevation of intracellular calcium ions in TM cells.
(A and B) Yoda1 triggers a robust increase in [Ca2+]i that was abolished in Ca2+-free extracellular solution. N = 2 eyes, n = 39 cells for control and N = 2, n = 61 cells for “0 Ca2+” conditions, respectively. (C) Bar graphs summarizing results illustrating in A and B. Shown the mean ± SD. ####, p < 0.00001; n > 50 cells, paired-sample t-test. (D) Ruthenium red (RR; 10 μM) abolished effect of Yoda1 (10 μM) on [Ca2+]i. (E) Bar graphs summarizing results shown in D. Shown the mean ± SD. N.S.p = 0.1378; **p = 0.0018; ***p < 0.00001. n = 14 cells, paired-sample t-test. RR: ruthenium red, Y: Yoda1. (F) Elevation of [Ca2+]i by Yoda1 (10 μM) is attenuated in the presence of GsMTx4 (5 μM). Shown are averaged traces (the mean ± SEM) for untreated control cells (n = 17 cells; filled symbols) and GsMTx4-treated cells (n = 15 cells). (G) Bar graphs summarizing inhibitory effect of GsMTx4 on Yoda1-induced elevation of [Ca2+]i. ###p < 0.00001, two-sample t-test. (H) Representative F340/F380 nm traces illustrating effects of Piezo1 shRNA on Yoda1-mediated elevation of [Ca2+]i. The black trace represents control (Sc) and the red trace represents Piezo1 shRNA. (I) Bar graphs summarizing results shown in H. Shown the mean ± SD. #p = 0.0204; N = 4 coverslips per each condition (Sc shRNA: 24 - 45 cells per coverslip; Piezo1 shRNA: 7 – 17 cells per coverslip), two-sample t-test.

