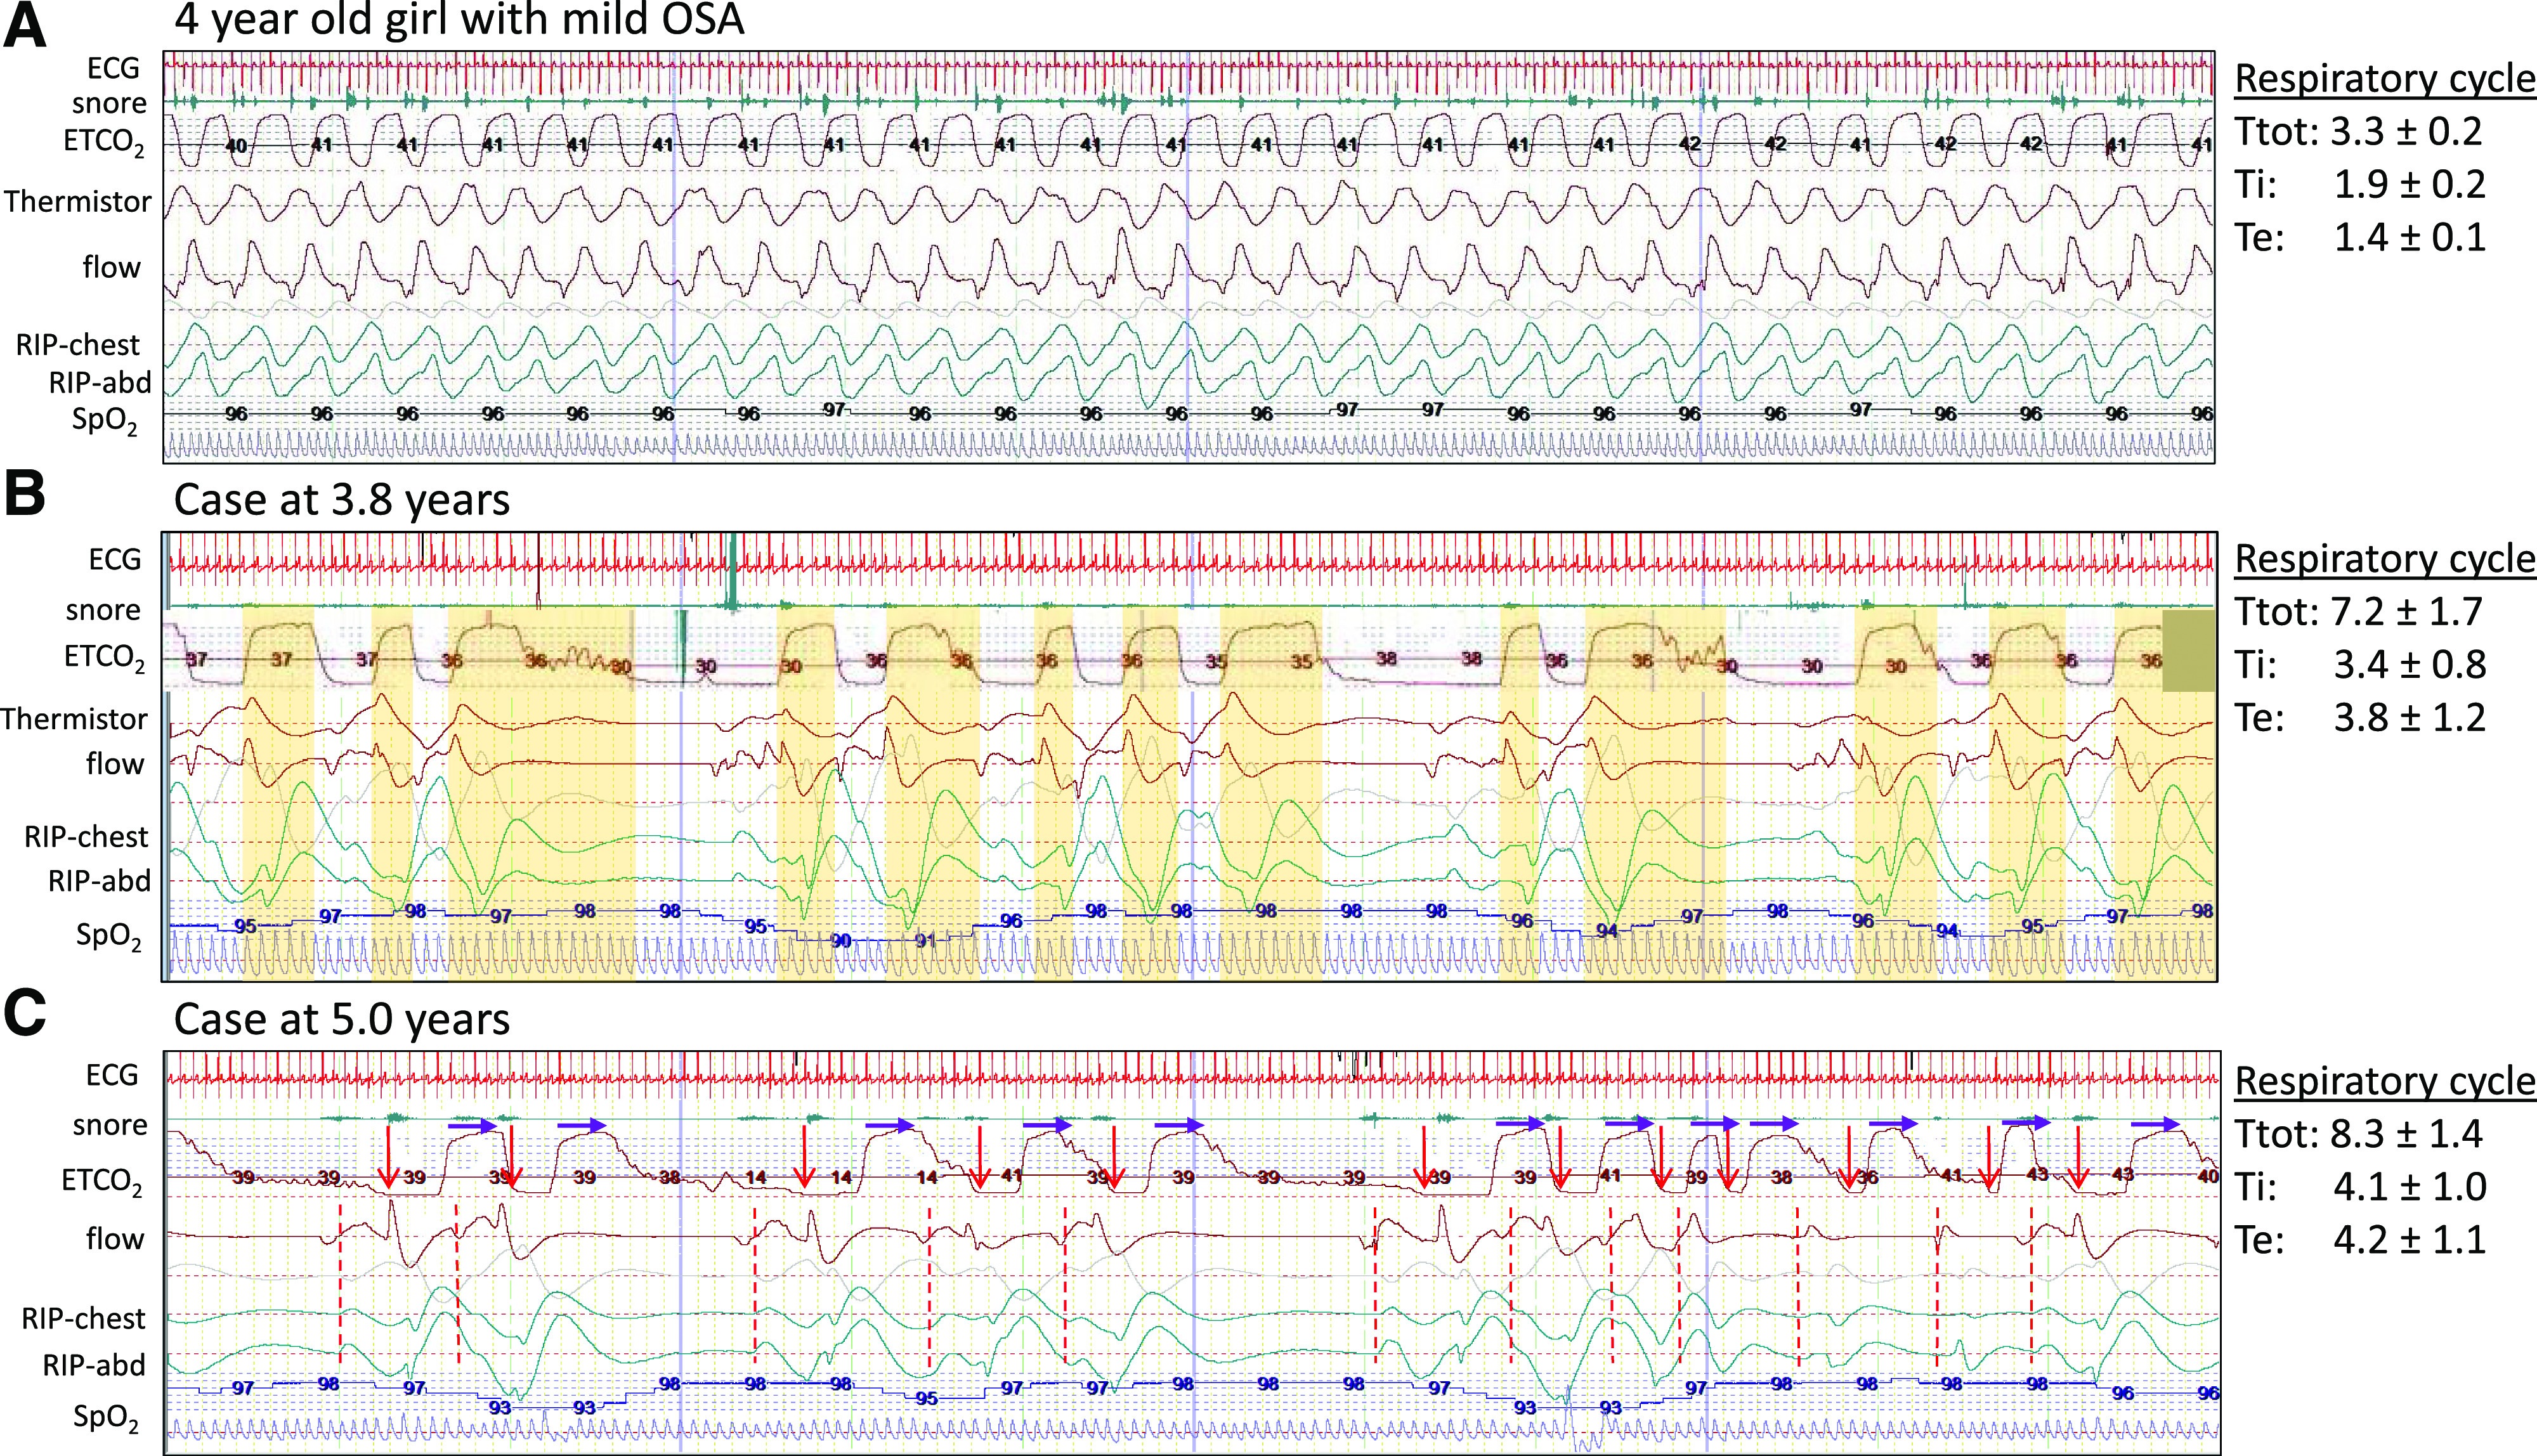
Figure 2. Polysomnogram demonstrating respiratory cycle variability in NREM sleep.

Images are of a 2-minute segment from baseline polysomnogram comparing an age-matched, relatively healthy child with the patient at 3.8 years and 5 years of age. The respiratory cycle values to the right note the average and standard deviation of total cycle time, inspiratory time, and expiratory time for the breaths in the first 30 seconds of the 2-minute segment. (A) A 4-year-old girl with mild pediatric OSA. Note the normal (monotonous) respiratory pattern and stable respiratory cycle times. (B) Our patient at 3.8 years of age. The ETCO2 waveform is manually shifted 3 seconds earlier to account for recording delay compared to flow and respiratory effort bands (RIP). The vertical yellow bars indicate the expiratory component of each respiratory cycle. Note the wide variability and absent pattern. (C) Our patient at 5 years of age. The start of inhalation is noted by a red arrow and dashed line. The purple arrows are of fixed length and indicate the start of exhalation. Again, note the absence of distinct pattern and wide variability in both inspiratory time and expiratory time with slower respiratory rate at 6–10 breaths per minute. ETCO2 = end-tidal carbon dioxide; NREM = non–rapid eye movement; OSA = obstructive sleep apnea; RIP = respiratory inductance plethysmography.
