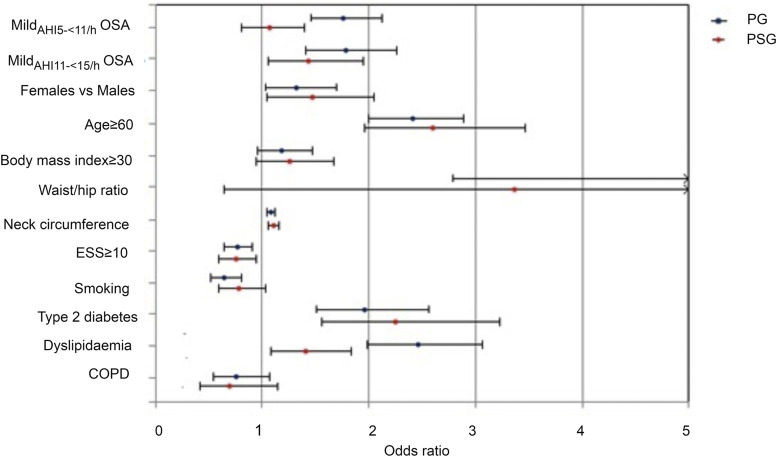
Figure 2. Multiple logistic regression analysis of the relationship between systemic arterial hypertension and mild OSA groups according to type of study (polygraphy or polysomnography).
Error bars indicate 95% confidence intervals. COPD = chronic obstructive pulmonary disease, ESS = Epworth Sleepiness Scale, OSA = obstructive sleep apnea.

