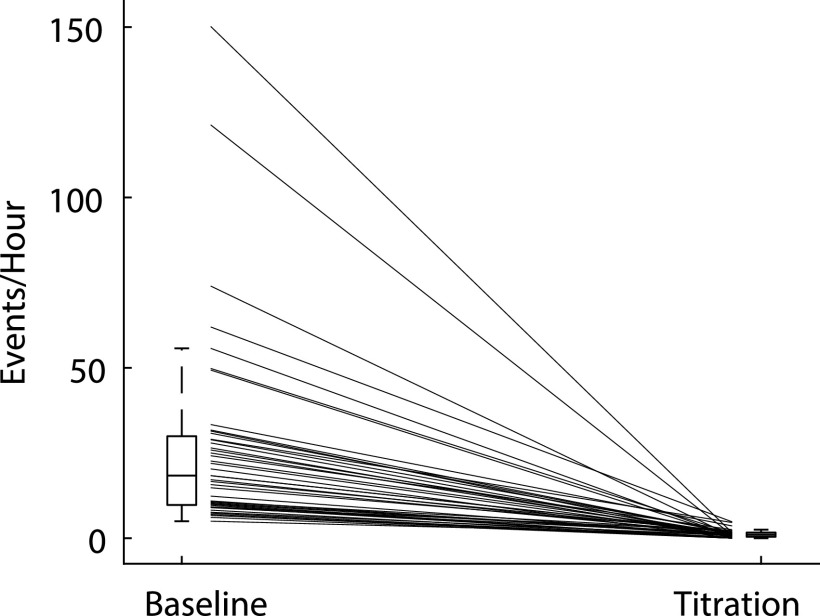
Figure 1. The obstructive apnea-hypopnea index (OAHI) during baseline study and at the optimal pressure during a titration study.
Box and whiskers plot of the OAHI during baseline and titration study. The box represents the 25th and 75th percentile with the median line. Whiskers extend approximately 1.5 times the interquartile range. The lines between 2 boxes connect baseline and titration OAHI for individual participants. Only participants whose OAHI decreased by at least 75% were included in the study.

