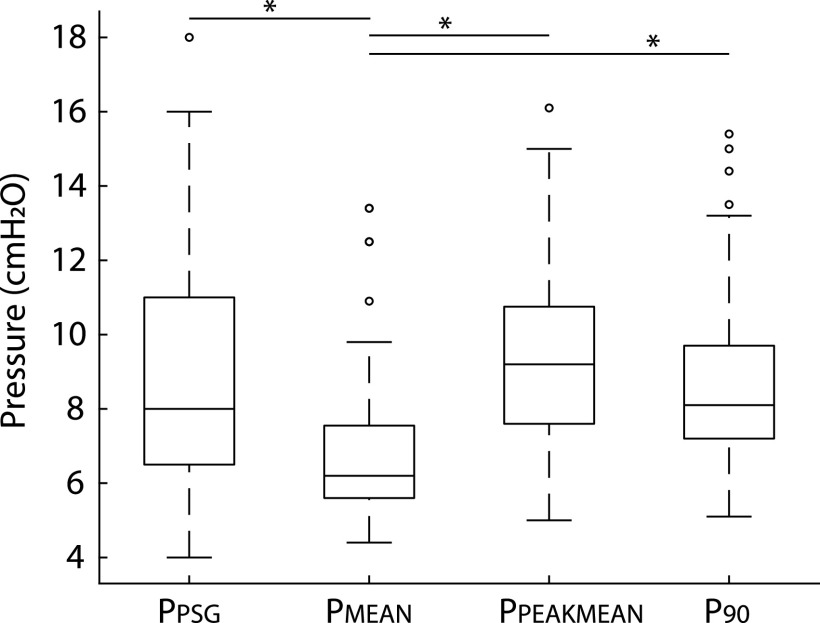
Figure 2. Comparison of titration pressure (PPSG) and autoCPAP PMEAN, PPEAKMEAN, and P90 pressures.
Box and whisker plot of the titration (PPSG) and 3 autoCPAP pressures. The box represents the 25th and 75th percentile with the median line. Whiskers extend approximately 1.5 times the interquartile range. The only pressure that was statistically significantly different from the other 3 pressures was PMEAN (P < .0002). AutoCPAP, auto-titrated continuous positive airway pressure, PMEAN = autoCPAP mean pressure, PPEAKMEAN = autoCPAP peak mean pressure, PPSG = optimal titration pressure, P90 = average pressure ≤90% of the time.

