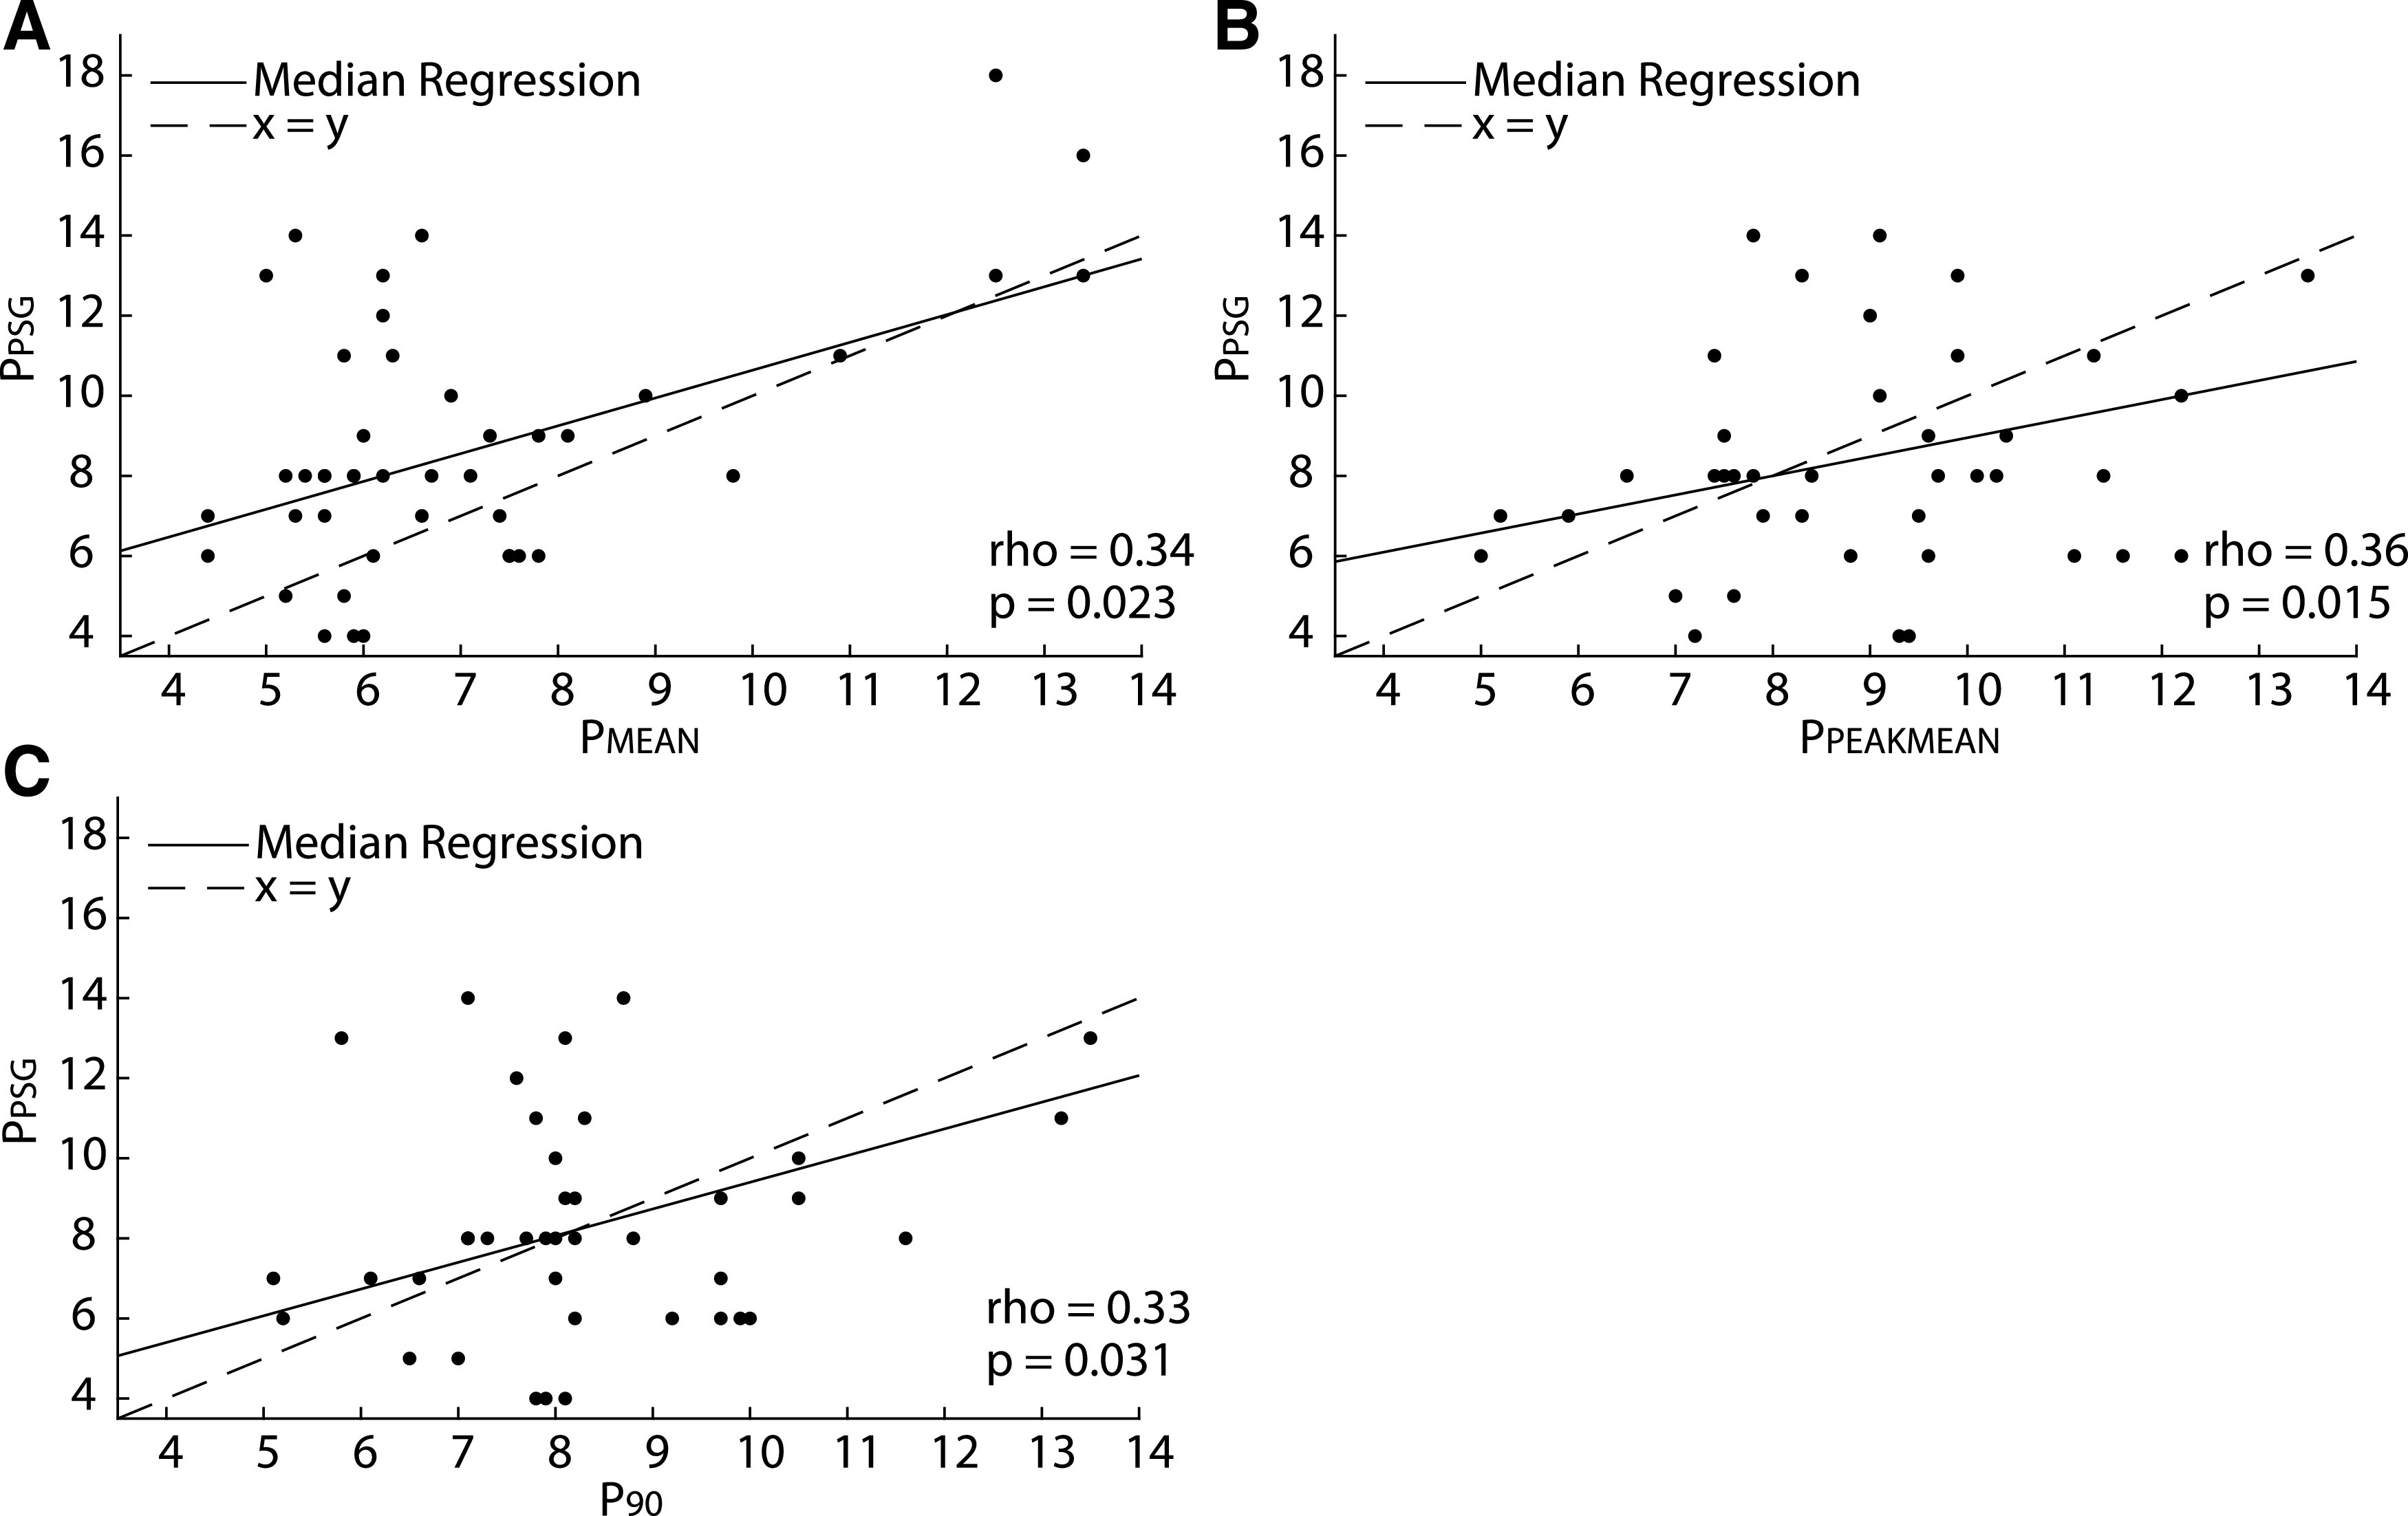
Figure 3. Median regression analysis of correlation between the titration pressure and 3 autoCPAP pressures.

Correlation calculation between titration pressure (PPSG) and (A) autoCPAP mean pressure (PMEAN), (B) peak mean pressure (PPEAKMEAN), and (C) average pressure ≤ 90% of the time (P90) using Spearman rank correlation. There was significant correlation between all three autoCPAP pressures and the titration pressure. AutoCPAP, auto-titrated continuous positive airway pressure,
