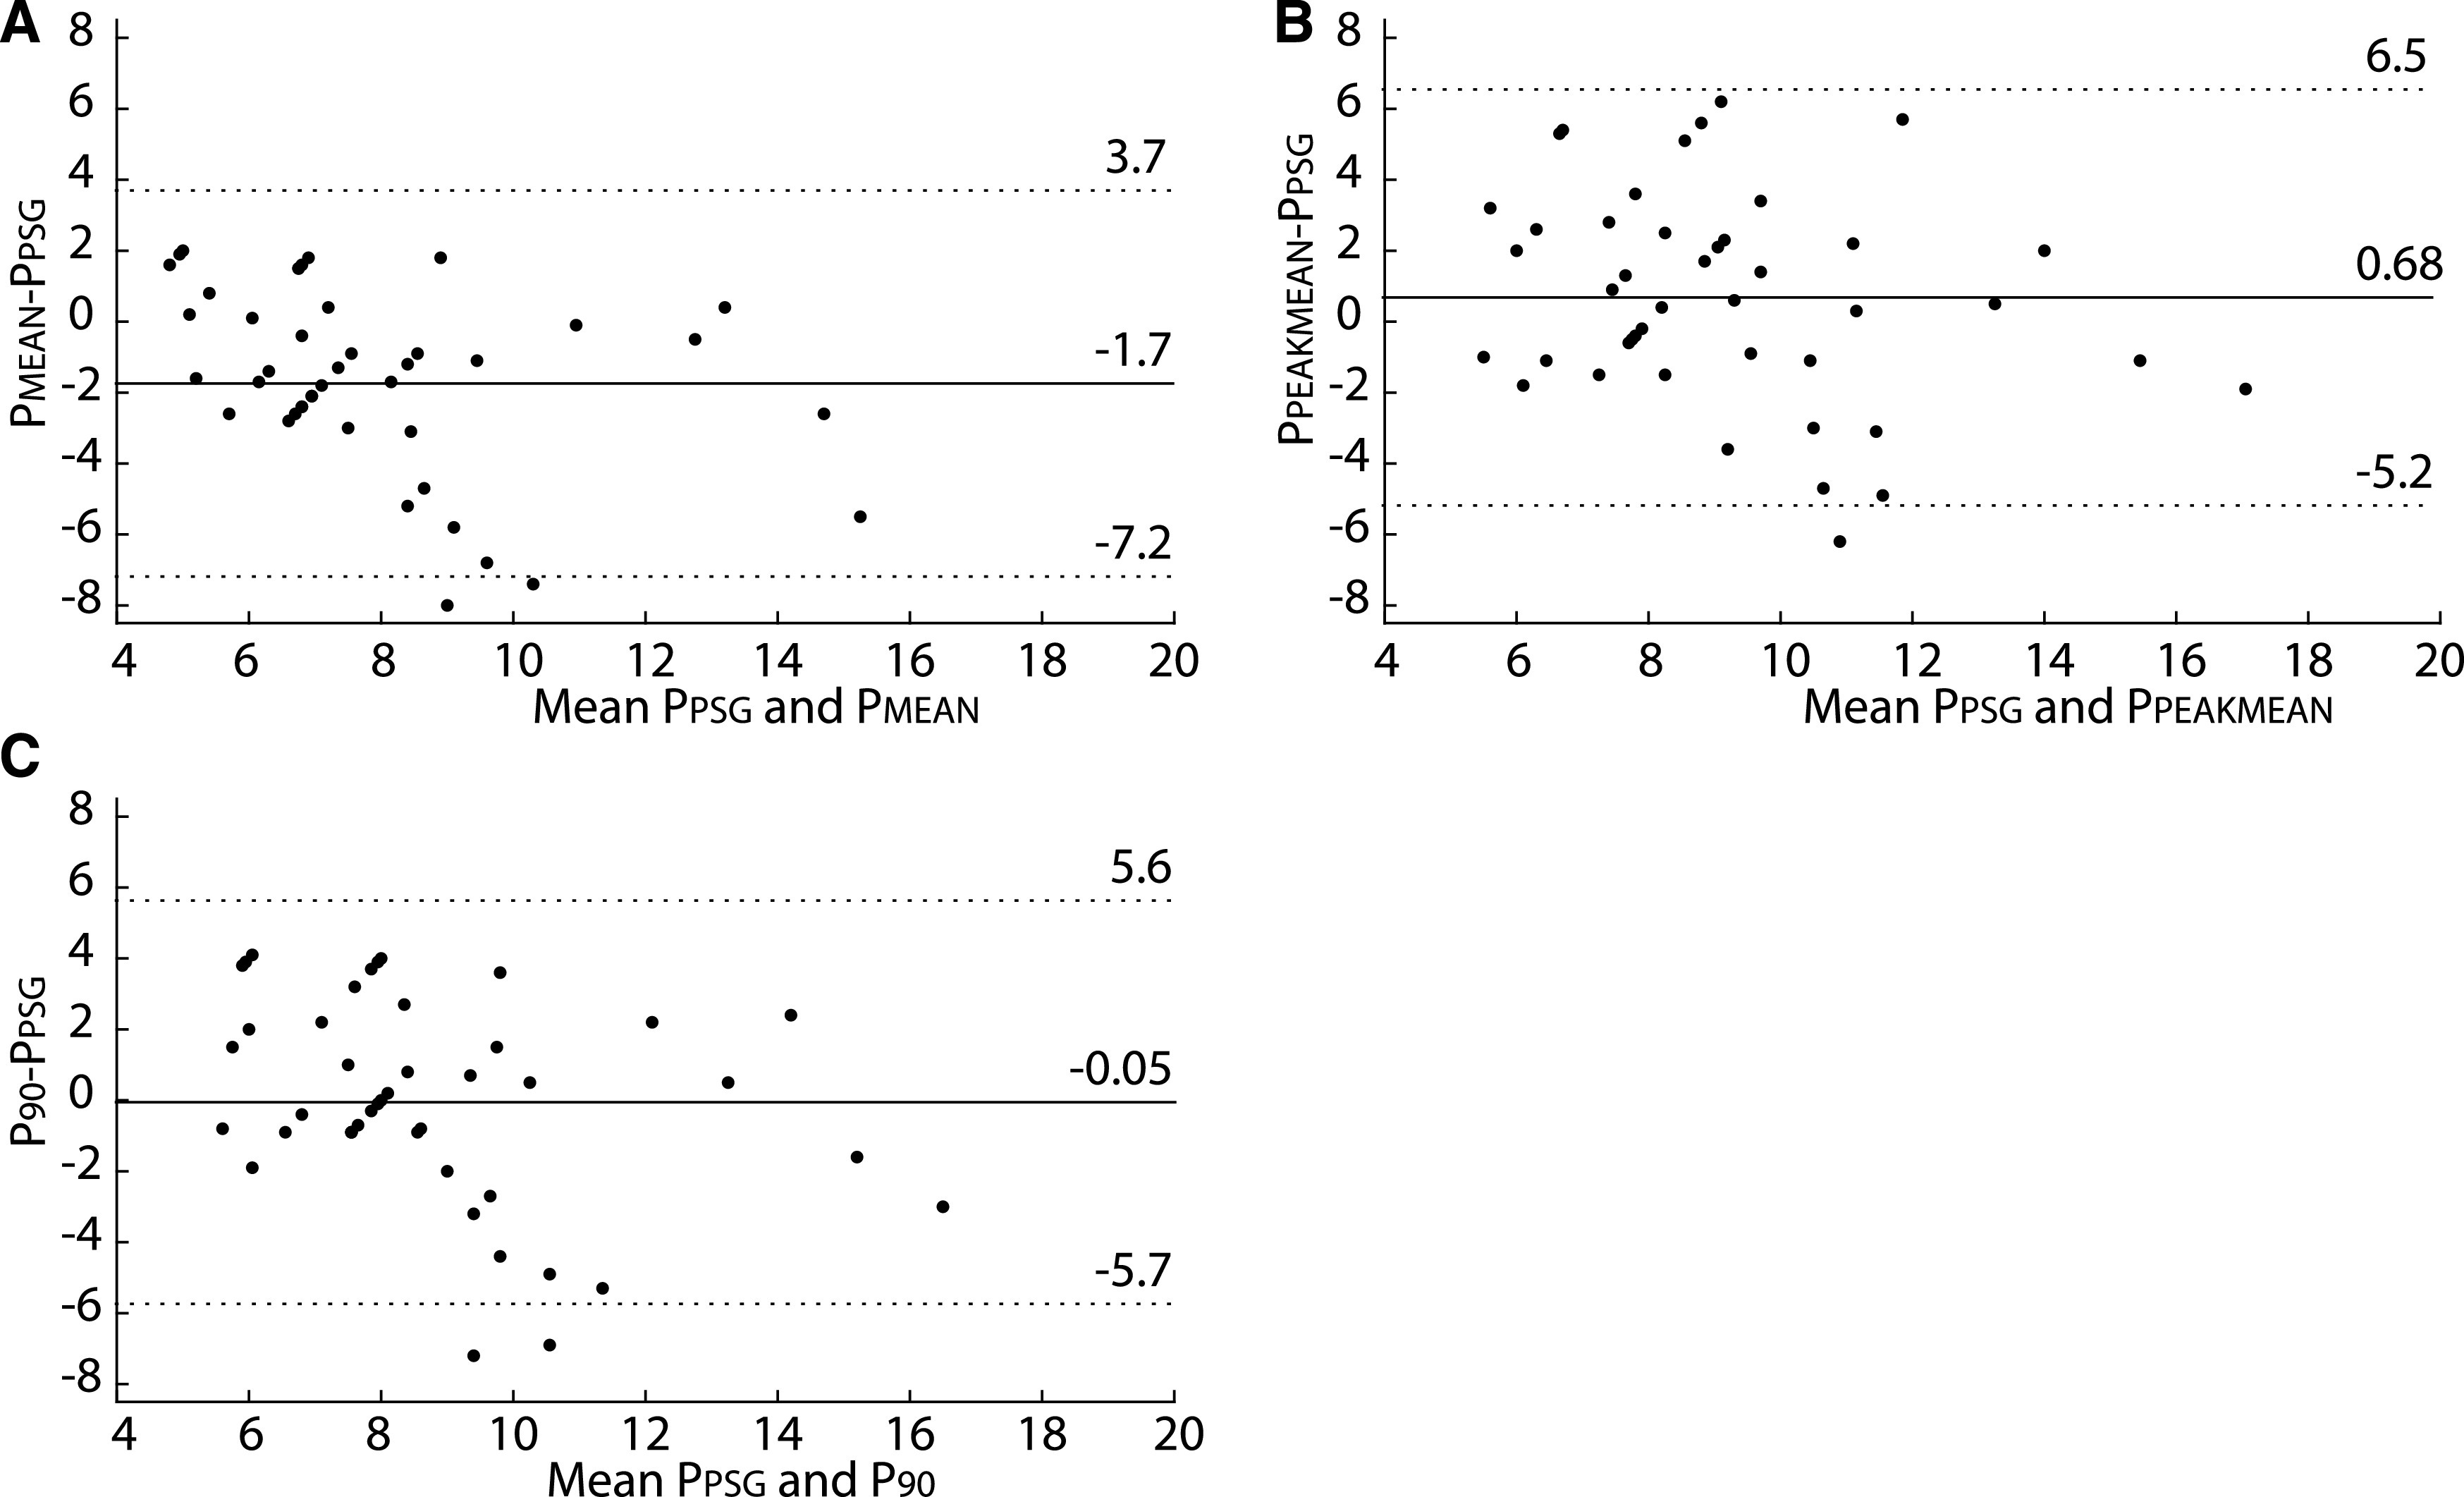
Figure 4. Bland-Altman plots of comparison of the titration pressure and 3 autoCPAP pressures.

Bland-Altman plots of titration pressure (PPSG) compared with 3 autoCPAP pressures. (A) PPSG compared with PMEAN. (B) PPSG compared with PPEAKMEAN. (C) PPSG compared with P90. Means of PPEAKMEAN and P90 were similar to the titration pressure. PMEAN was smaller than the titration pressure. Each dot shows the average of 2 pressures on the x-axis vs difference of 2 pressures on the y-axis for a single participant. AutoCPAP, auto-titrated continuous positive airway pressure, interrupted horizontal lines = ±1.96 times the standard deviation of the differences between pressures, solid horizontal line = mean of the differences.
