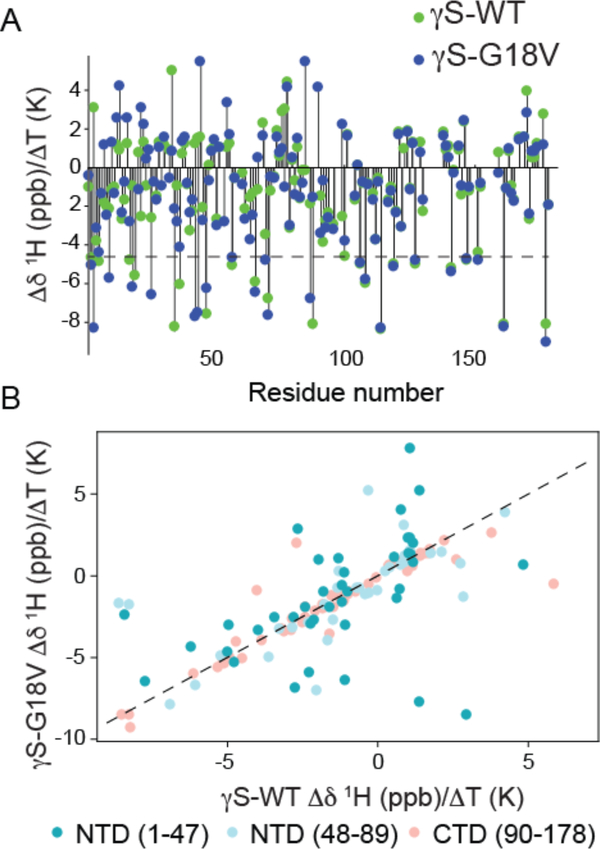
Figure 4.
A. Comparison of the NH temperature coefficient, Δδ/ΔT, for γS-WT (green) and γS-G18V (blue). Most Δδ/ΔT values for residues in the C-terminal domain are unchanged, while, many Δδ/ΔT values for residues in the N-terminal domain differ between γS-G18V and γS-WT. Values above the dotted line at −4.6 ppb are indicative of residues involved in intramolecular hydrogen bonds, and those below ones that are hydrogen bond to solvent. B. NH temperature coefficients, Δδ/ΔT, for γS-WT (x-axis) vs. γS-G18V (y-axis). The largest deviations in the NH temperature coefficient are observed in the N-terminal domain closest to the mutation site (dark teal), with significant deviations also occurring in the latter part of the N-terminal domain (light blue). Few differences are seen in the C-terminal domain (salmon), mostly corresponding to residues in the interdomain interface. The dashed line has a slope of 1 as a guide to identify the residues for which γS-WT and γS-G18V have the same Δδ/ΔT values.

