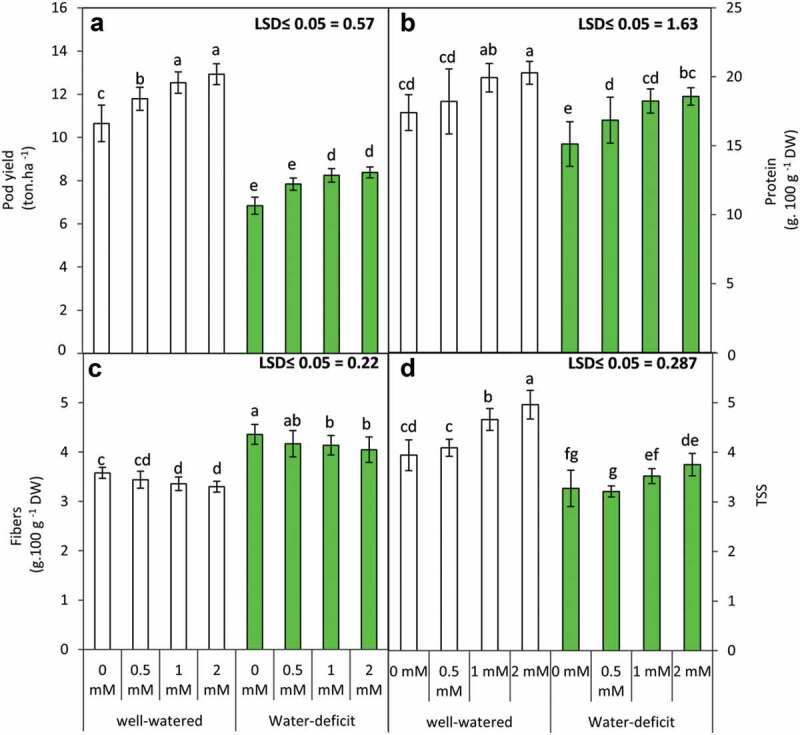
Figure 5.

Pod yield (a) and its content from protein (b), fibers (c) and total soluble solids “TSS” (d) of the snap bean plants as influenced by the foliar application of GABA (0, 0.5, 1 and 2 mM) under two irrigation regimes. Means were presented ± SD. Different letters are significant differences, according to LSD’s multiple range tests (P < .05)
