
Figure 4.
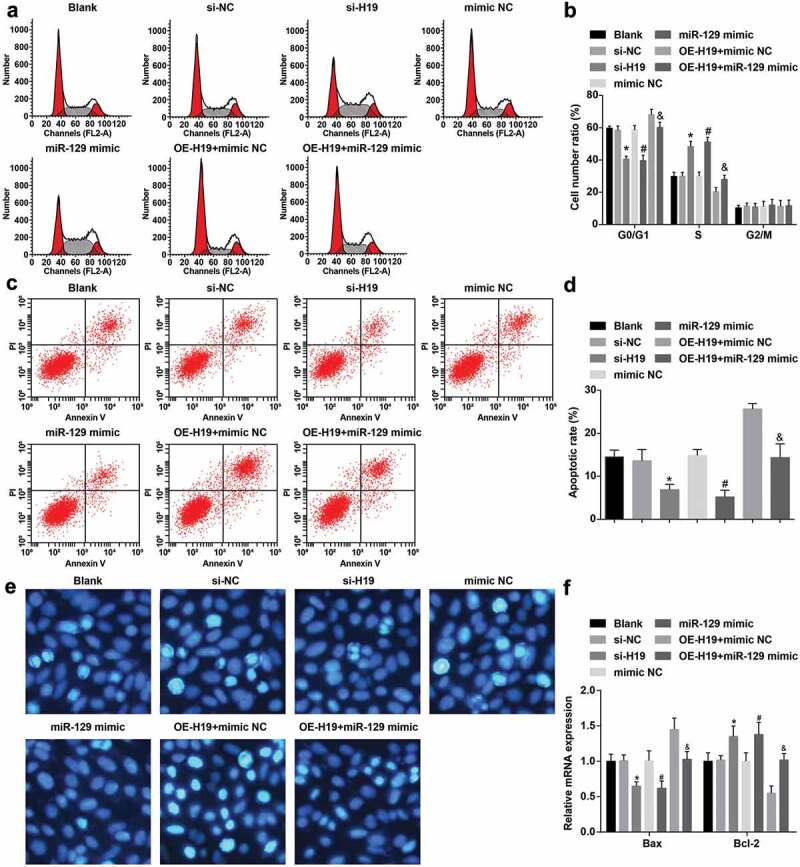
Decreased H19 or elevated miR-129 accelerate cell cycle entry and restrain apoptosis of PC12 cells induced by Aβ25-35. A. Aβ25-35-treated PC12 cell cycle distribution tested by flow cytometry; B. Quantification results of panel A; C. The apoptosis of Aβ25-35-treated PC12 cells tested by flow cytometry; D. Quantification results of panel C; E. The apoptosis of Aβ25-35-treated PC12 cells detected via Hoechst 33,258 staining; F. Bax and Bcl-2 mRNA expression in Aβ25-35-treated PC12 cells tested by RT-qPCR; The data in the figure were all measurement data, in the form of mean ± standard deviation. One-way ANOVA was functioned for comparison among multiple groups. Tukey’s post hoc test was employed in pairwise comparison after ANOVA analysis. N = 3, * vs the si-NC group, P < 0.05; # vs the mimic NC group, P < 0.05; & vs the OE-H19 + mimic NC group, P < 0.05