
Figure 5.
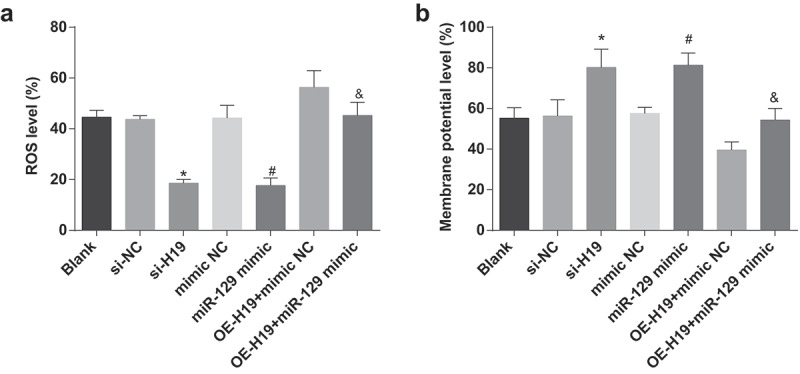
Reduction of H19 or elevation of miR-129 decrease ROS and elevate MMP expression in PC12 cells induced by Aβ25-35. A. ROS in Aβ25-35-treated PC12 cells after transfection; B. MMP in Aβ25-35-treated PC12 cells after transfection. The data in the figure were all measurement data, in the form of mean ± standard deviation. One-way ANOVA was functioned for comparison among multiple groups. Tukey’s post hoc test was employed in pairwise comparison after ANOVA analysis. N = 3, * vs the si-NC group, P < 0.05; # vs the mimic NC group, P < 0.05; & vs the OE-H19 + mimic NC group, P < 0.05