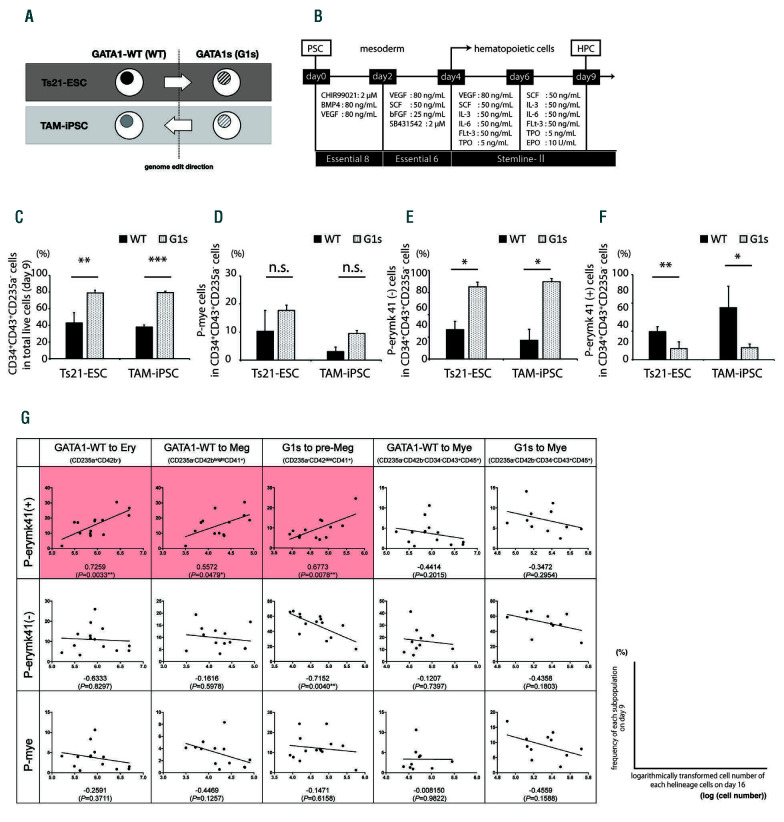
Figure 1.
GATA1-dependent differences in the CD34+CD43+CD235- progenitor stage. (A) Schema of the GATA1-wild-type (WT) and GATA1-mutated (G1s) Ts21- pluripotent stem cell (PSC) line panels used in this study. (B) Protocol for sequential hematopoietic progenitor cell differentiation. (C) Percentages of CD34+CD43+CD235- cells on day 9. P-values between WT and G1s Ts21-embryonic stem cells (ESC): P=0.0079; and between transient abnormal myelopoiesis (TAM)-induced pluripotent stem cells (iPSC)(TAM-iPSC) WT and G1s: P<0.0001. (D) Percentages of P-mye (CD34+CD43+CD235-CD11b+CD41-) in CD34+CD43+CD235- cells on day 9. (E) Percentages of P-erymk41(-) (CD34+CD43+CD235-CD11b-CD71+CD41-) in CD34+CD43+CD235- cells on day 9. P-values between WT and G1s Ts21-ESC: P=0.0303; and between WT and G1s TAM-iPSC: P=0.0134. (F) Percentages of P-erymk41(+) (CD34+CD43+CD235-CD11b- CD71+CD41+) in CD34+CD43+CD235- cells on day 9. P-values between WT and G1s Ts21-ESC: P=0.016; and between WT and G1s TAM-iPSC: P=0.0199. Student’s t-test. Data are shown as the mean + standard deviation. *P<0.05, **P<0.01, ***P<0.001; n.s: not significant; n = 3-4. (G) Table of the correlation between the percentage of each subpopulation on day 9 (column headings, y-axis) and logarithmically-transformed cell number of the resultant lineage-committed cells on day 16 (row headings, x-axis) of the culture. Correlation coefficients and P-values (Pearson correlation in GraphPad Prism) for each square are described under each regression line. *P<0.05, **P<0.01; n=10-14.

