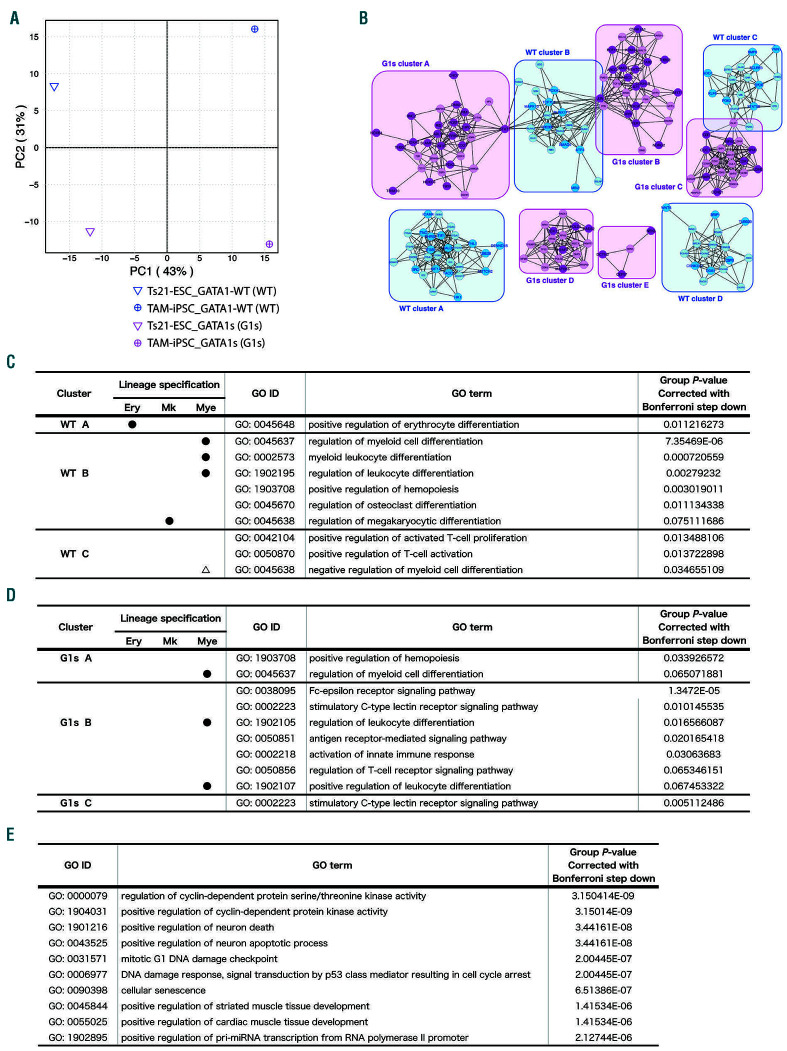
Figure 2.
P-erymk41(+) with GATA1 mutation display activation of pathways that cause abnormal myelopoiesis. (A) Principal component analysis (PCA) mapping P-erymk41(+) (CD34+CD43+CD235-CD11b-CD71+CD41+)of GATA1-wild-type clones (WT-clones) and GATA1-mutated clones (G1s-clones) from Ts21-embryonic stem cells (Ts21-ESC) and transient abnormal myelopoiesis (TAM)-induced pluripotent stem cell (TAM-iPSC) strains. (B-F) The results of a clustering algorithm for automated functional annotations. (B) An expanded map showing the clusters of genes extracted by the positive correlation (correlation index >0.8 in the PCA shown in (A)) with WT (blue) and G1s (-) (magenta). The closed circles depict genes originally included in the PCR array. Open circles depict genes replenished by GENEMANIA. Each gene is listed in the Online Supplementary Table S4. (C-E) The intracellular pathways specifically enriched in (C) WT and (D) G1s cell populations. GO terms with P<0.08 in Bonferroni step down analysis are listed. No significant GO terms for gene sets categorized to WT cluster D or G1s clusters D or E were enriched. The closed circles in (C) and (D) show the lineage specifications indicated by GO terms. The open triangle in (C) depicts the indicated negative relationship to myeloid differentiation. (E) The intracellular pathways specifically enriched in the G1s-clones P-erymk41(+) filtered by “biological process”. The top 10 GO terms based on P-values corrected with Bonferroni step down <0.001 are listed.

