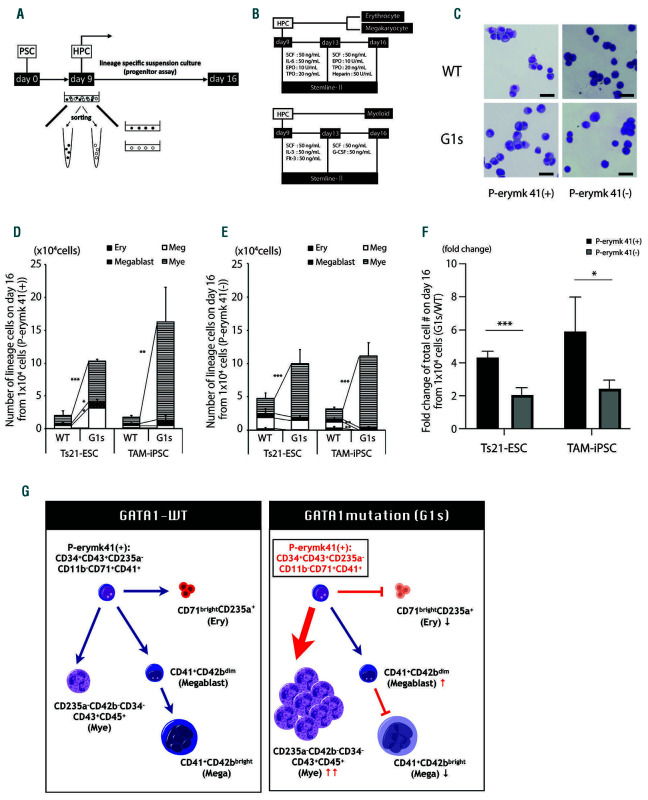
Figure 3.
P-erymk41(+) are an origin of predominant myelopoiesis. (A-B) Schematic process of the progenitor assay. (C) Morphology (May-Grunwald Giemsa staining) of sorted progenitor cells. Representative cells from GATA1-wild-type clones (WT-clones) and GATA1-mutated clones (G1s-clones) from transient abnormal myelopoiesis (TAM)-induced pluripotent stem cell (TAM-iPSC) lines are shown. Scale bars, 25 mm. (D-E) Number of lineage cells derived from 1x10⁴ sorted (D) P-erymk41(+) (CD34+CD43+CD235-CD11b-CD71+CD41+) and (E) P-erymk41(-) of each clone under myeloid lineage-specific differentiation condition. (D) P-values compare Ery (erythrocytes), Meg (megakaryocytes), Megablast (magakaryoblasts), and Mye (myeloids) between WT and G1s Ts21-embryonic stem cells (Ts21-ESC): P=0.6777, P=0.0153, P=0.0121 and P<0.0001; and between WT and G1s TAM-iPSC: P=0.0603, P=0.8109, P=0.1407 and P=0.0018, respectively. (E) P-values compare Ery, Meg, Megablast, and Mye between WT and G1s Ts21-ESC: P=0.0806, P=0.6408, P=0.6860 and P=<0.0001; and between WT and G1s TAM-iPSC: P=0.0071, P=0.0087, P=0.5668 and P<0.0001, respectively. Student’s t-test. Data are presented as the mean + standard devaition. *P<0.05, **P<0.01, ***P<0.001; no mark: not significant; n = 3-7. (F) Fold changes of the total cell number calculated from the ratio of each G1s-clone per WT-clone on day 16. P-values compare Ts21-ESC, TAM-iPSC between P-erymk 41(+) and P-erymk 41(-): P<0.001 and TAM-iPSC (-): P=0.021279, respectively. Multiple comparisons using the Holm-Sidak method. Data are presented as the mean + standard devaition. *P<0.05, **P<0.01 and ***P<0.001; n = 3-7. (G) Graphical schematic showing the impact of GATA1 mutation on P-erymk41(+) in our hematopoietic system.

