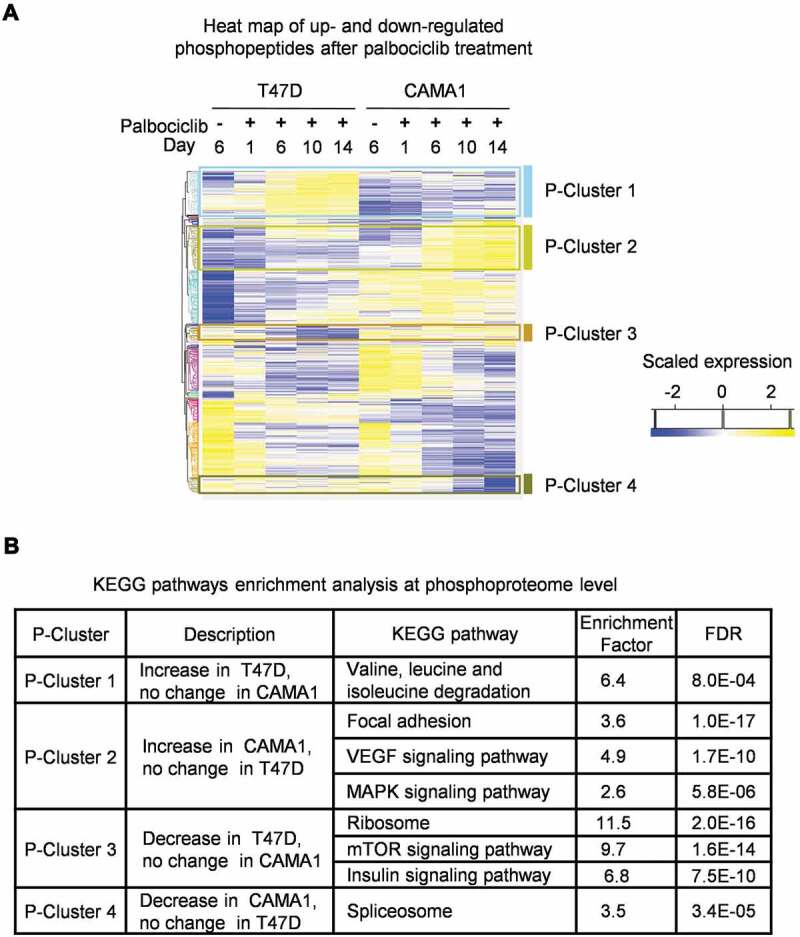
Figure 2.

Phosphoproteomics profiling reveals differential regulation of mTORC1 signaling in T47D versus CAMA1 cells in response to palbociclib treatment. (A) Heatmap showing log2 transformed and scaled abundance of phosphopeptides with significant changes in T47D and CAMA1 cells treated with vehicle only (-) for 6 days (to ensure log phase growth) or palbociclib (500 nM) for the indicated time points from three independent samples per condition. Hierarchical clustering of phosphopeptides with significant changes with treatment. (B) Pathway enrichment analysis of phosphoproteome clusters using KEGG database with Fisher Exact Test (Benjamini-Hochberg FDR ≤ 0.02) is shown
