
Figure 1.
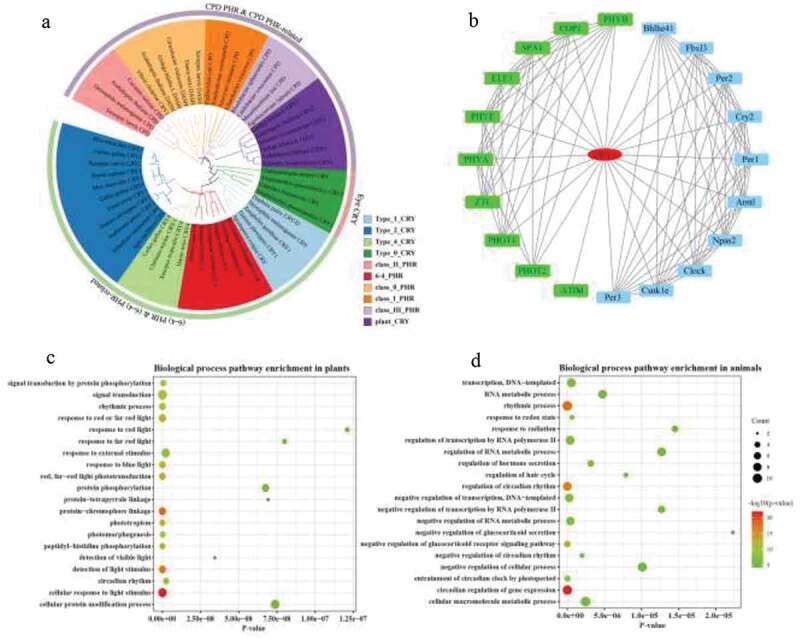
Phylogenetic tree analysis and function prediction of CRY1. (a) Phylogenetic analysis of ginkgo PHR/CRY family members. The color indicates the different subgroups. (b) Prediction of CRY1 protein-protein interaction network. Green represents the predicted results of protein-protein interaction in plants, and blue represents the predicted results of protein-protein interaction in animals. (c) GO enrichment analysis of CRY1 interacting protein in plants and (d) animals. The color indicates the q-value, with a lower q-value indicating more significant enrichment and the point size indicating the DEG number