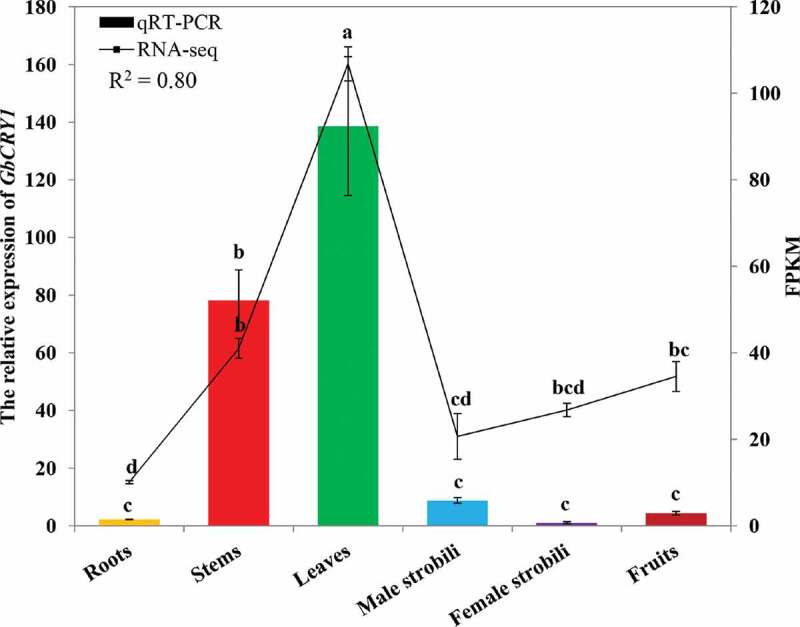
Figure 2.

Abundance of CRY1 expression in different tissues of G. biloba. The error bars represent the standard error of three biological replicates. Bar and line charts represent the qRT-PCR and FPKM values of the genes, respectively. The expression in female strobili of G. biloba was set as 1 and the different letters indicates values are significantly different at P < .05. The R2 value represents the correlation between the qRT-PCR and FPKM values
