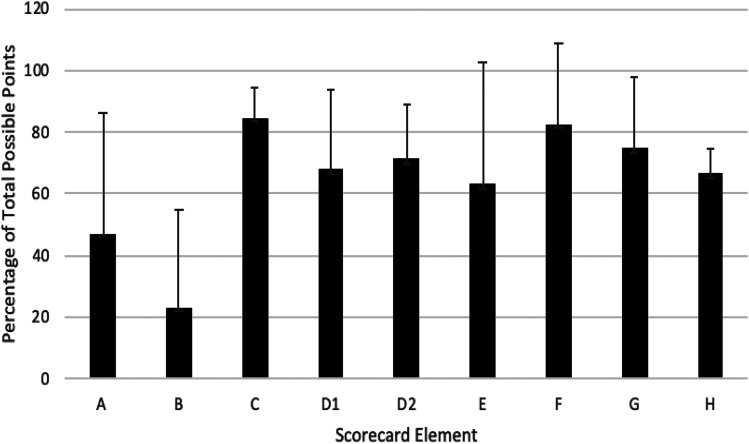
Figure 3. Average percentage of total possible points achieved for each scorecard criteria element.
The average percentage of total possible points is represented since criteria A and E have 15 possible points and the other criteria have 10 possible points. Error bars represent the standard deviation of the average score.

