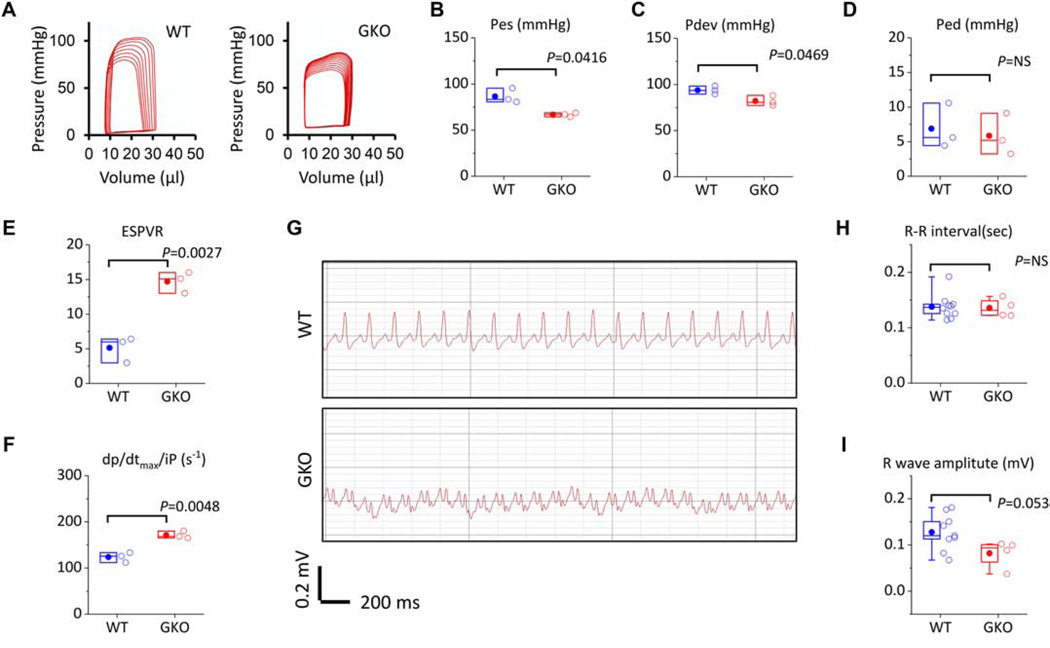
Figure 2. Hemodynamics and electrophysiology in adult WT and ROMK-GKO mice (GKO).
(A) Representative pressure-volume (PV) loops obtained by in situ LV catherization and vena cava occlusion for progressively decreased preload. (B-D) Preload-dependent parameters of contractility in WT vs. GKO animals (E-F) Preload-independent parameters of contractility. Pes; pressure at end-systole, Ped; pressure at end-diastole, Pdev; developed pressure, Espvr; end-systolic pressure-volume relationship (preload independent), dp/dtmax/iP; dp/dt max normalized by instantaneous pressure (preload independent). n=3 for WT and GKO mice, Indicated P values are from two tailed t-tests (G) Representative electrocardiograms (ECG) obtained with a configuration-II surface lead placed on lightly anesthetized mice. The ECG in GKO animals appears strikingly different from WT presenting similarities to a right bundle branch block. (H-I) R-R interval and R wave amplitude in WT vs. GKO animals, n=9 WT and n=4 for GKO mice, P values are from two tailed t-tests. In the scatter box plots, boxes cover the 25–75% range of data, the mean is shown as a solid dot and the median as a line. Whiskers cover the 5–95% range.

