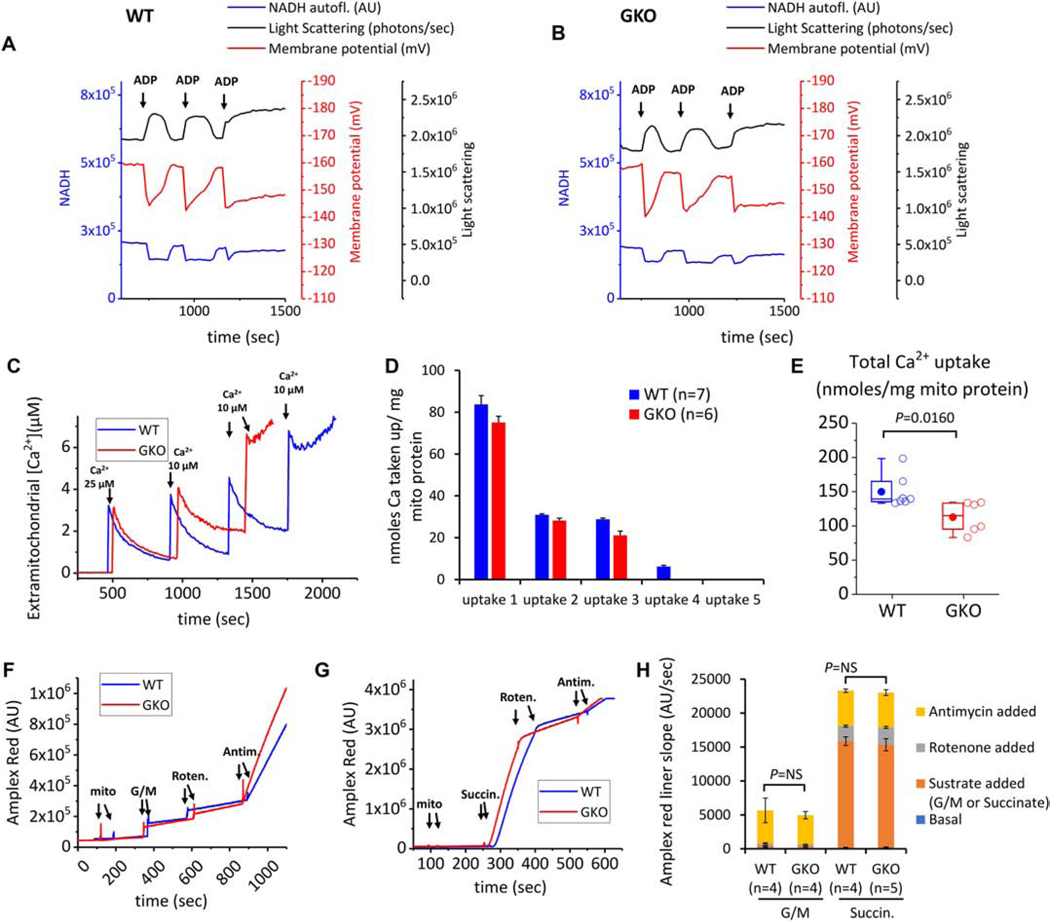
Figure 3. Multiparametric analysis of mitochondrial function in isolated mitochondria from WT and GKO hearts.
(A-B) Representative results of mitochondria matrix contraction and recovery in respiring mitochondria from WT and GKO mitochondria (left panel and right panel respectively). Changes in matrix volume are monitored by light scattering (absorbance at 540 nm, black trace). Additionally recorded is mitochondrial membrane potential (determined from ratiometric measures of TMRM at ex./emm. 546/590 and 573/590, red trace) and NADH oxidation/reduction (ex./emm. 340/450 nm, blue trace). The incubation medium contains 0.5 mg mitochondria and 5 mM each of the substrates glutamate, malate and succinate. The medium also contains ~150 mM K+. At the indicated times (arrows), 200 μM ADP are added to the incubation medium and changes in mitochondrial light scattering are recorded along with the other two bioenergetic parameters. (C) Aliquots of mouse heart mitochondria (0.5 mg) were added to 2.0 ml assay buffer containing 100 nM Calcium Green 5N, 300 nM TMRM, and 5 mM each of glutamate and malate (G/M). The first calcium addition is 25 μM and each subsequent addition is 10 μM. Calcium green fluorescence units were converted to free [Ca2+] using a calibration curve constructed from separate experiments using identical incubation and acquisition conditions in the presence of depolarized mitochondria. Multiple known calcium additions were performed and free extramitochondrial [Ca2+] was calculated using MaxChelator to account for the presence of EGTA in the buffer. The curve was fitted to the equation [Ca2+]=kd(F-Fmin)/(Fmax-F), where F is fluorescence intensity of Calcium Green 5N (ex./emm. 505/535 nm). From this equation the apparent dissociation constant of calcium green for Ca was found to be kd = 27.03. Representative Calcium Green traces from 7 and 6 runs for WT and GKO mitochondria are shown. The end of the experiment is determined by the onset of mitochondrial permeability transition evident by rapid efflux of calcium into the incubation medium. (D-E) Per addition and total Ca taken up by energized mitochondria. Results are reported as nanomoles of taken up Calcium normalized to 1 mg mitochondrial protein. (F-G) Representative traces of Amplex Red fluorescence (ex./emm. 530/590 nm) to monitor mitochondrial H2O2 production in the presence of substrates (added to a final concentration 5 mM) and the inhibitors Rotenone and Antimycin A (final concentration 500 nM each). The reaction contained contains 100 μg mitochondria and rates of H2O2 production were determined from the linear part of each stage of the experiment (H) Summary of H2O2 production in WT and GKO mitochondria energized with substrates and inhibitors to manipulate ROS production from complex I or complex III.

