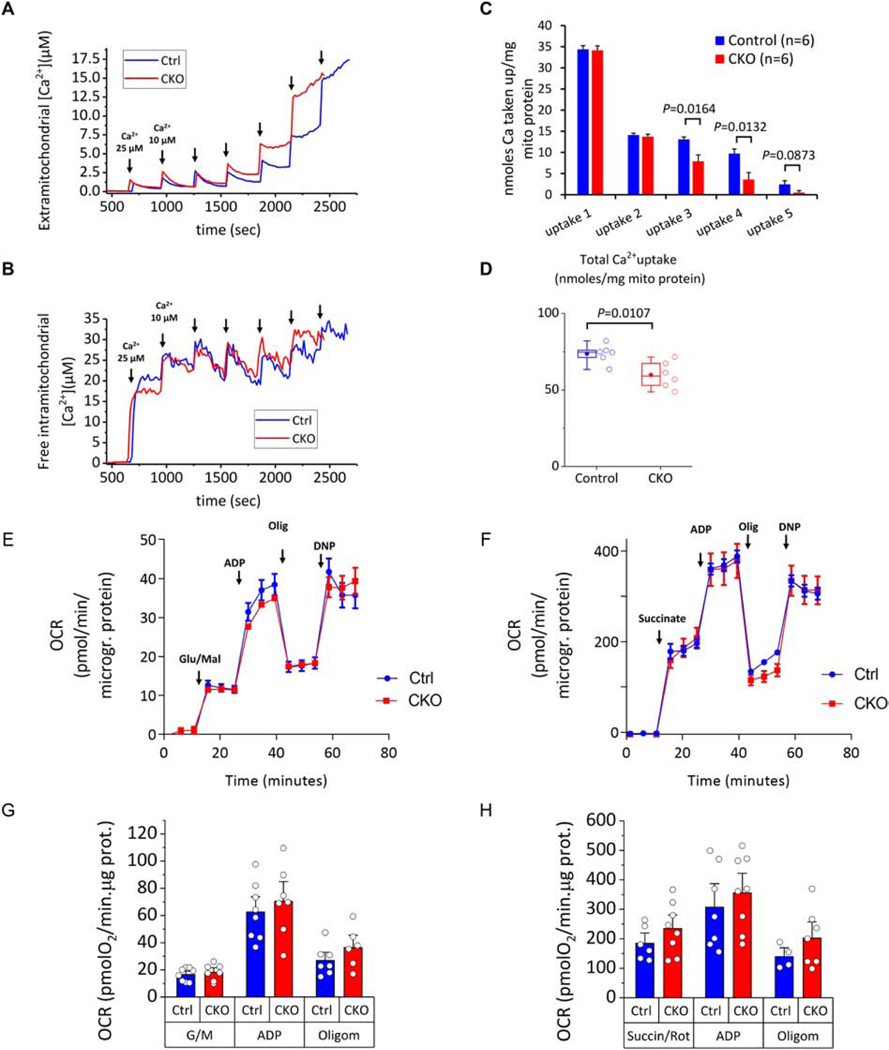
Figure 6. Analysis of Ca2+–induced permeability transition pore (PTP) opening, intramitochondrial Ca2+ handling and respiratory capacity in Control and CKO mitochondria.
Isolated heart mitochondria (1.0 mg mitochondrial protein) were added to a stirred cuvette containing 100 nM Calcium Green 5N, 300 nM TMRM, and 5 mM each of glutamate and malate (G/M) and succinate in 2.0 ml assay buffer. The first calcium addition is 25 μM and each subsequent addition is 10 μM. Calcium green fluorescence units (ex./emm. 505/535 nm) were converted to free [Ca2+] using a calibration curve as described previously. For monitoring intramitochondrial calcium, mitochondria were preloaded with [20 μM] of the ratiometric calcium probe Fura-FF-AM for 25 min. Ratios (R) of Fura-FF fluorescence (ex./emm. 340/510 nm and 380/510 nm for calcium-bound and calcium-free probe respectively) were calculated and results applied to the equation [Ca2+]=kd(R-Rmin)/(Rmax-R) to convert fluorescence to free intramitochondrial [Ca2+]. The kd was calculated by fitting the equation to a calibration curve constructed with multiple pulses of 5mM CaCl2 added to a reaction identical to the one above and also in the presence of 2 μM of the ionophore A23187, 5 μg/ml Oligomycin and 5 μM FCCP. From this experiment we determined the Kd = 16.34 μM. (A) Representative Calcium Green traces converted to extramitochondrial [Ca2+] from Control and CKO mitochondria (blue and red traces respectively). The corresponding effects in intramitochondrial free calcium recorded simultaneously are shown below in panel D. The TMRM signal monitoring ΔΨm was omitted from these graphs for simplicity. The end of the experiment is determined when there is no more mitochondrial uptake and calcium is released into the medium. (B) Representative Fura-FF ratio traces converted to free (unbuffered) intramitochondrial [Ca2+] from Control and CKO mitochondria. The increases in free intramitochondrial calcium correspond to the additions of external calcium shown in A above. (C-D) Per addition and total Ca uptake in Control and CKO mitochondria. Results are reported as nanomoles calcium/mg mitochondrial protein. Each n represents a different mitochondrial preparation obtained from a pool of 3 hearts of the same group. P values indicated above the brackets represent assessment by two tailed t-tests. (E-F) Representative traces of oxygen consumption rate (OCR) normalized to mitochondrial protein concentration. Arrows indicate the sequential additions of substrates (Glutamate/Malate 5 mM each in E, Succinate/Rotenone 5 mM and 1 μM respectively in F), followed by ADP (1 mM), oligomycin (1 μg/ml) and the uncoupler dinitrophenol (DNP, 75 μM). Each datapoint represents the average of 16–24 wells within each group (± SEM) and three time points are collected for each stage of the experiment. Each run is conducted with mitochondria isolated from a combined pool of three hearts of the same genotype group. (G-H) Summarized results of OCR in Control and CKO mitochondria energized by Glutamate/Malate (G) or Succinate/Rotenone (H). Bars represent means ± SEM and each datapoint (open circle) indicates a separate mitochondrial prep obtained from a pool of three hearts of the same genotype (n ranges from 4–8 in the various conditions/groups). No significant differences are observed between the two groups within a given respiratory state.

