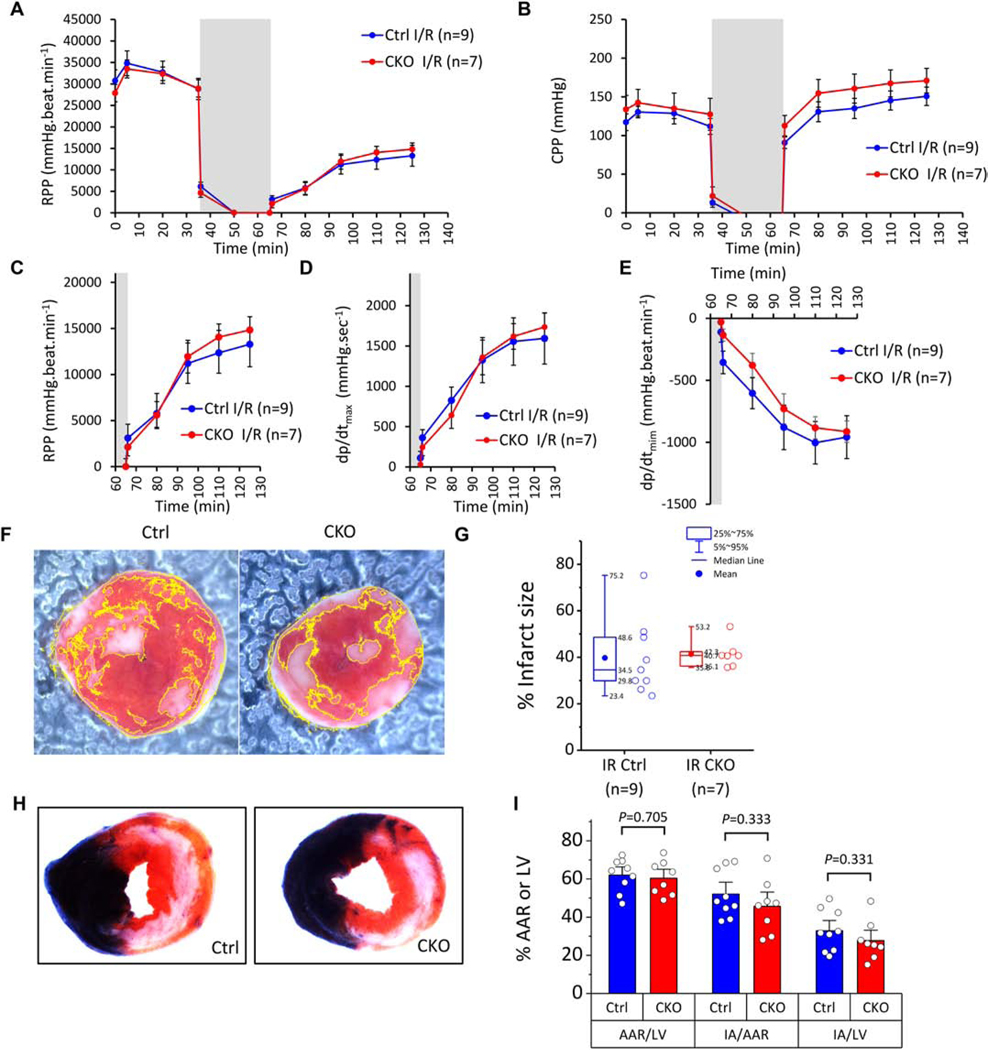
Figure 7. Response of ROMK Control and CKO hearts subjected to IR injury.
(A) Monitoring of rate pressure product (RPP) in Control and CKO hearts undergoing 35 min baseline perfusion followed by 30 min. global ischemia (grey area) and 1 hr. of reperfusion (I/R protocol). (B) Monitoring of coronary perfusion pressure (CPP). Dots represent within-group means and whiskers are standard errors of the mean. (C) Re-plotting data from A to examine post-ischemic RPP recovery within each genotype. (D-E) Post-ischemic recovery of systolic and diastolic function assessed by dp/dtmax and dp/dtmin respectively. Means comparisons between Control and CKO hearts for the three indexes (RPP, dp/dtmax and dp/dtmin) were performed with 2way repeated measures ANOVA. (F) Representative photos of heart slices stained with TTC at the end of reperfusion. Infarct areas (white) are delineated. (G) Infarct size (%) in Control and CKO hearts. Boxes cover the 25–75% range of data, the mean is shown as a solid circle and the median as a line. Whiskers cover the 5–95% range (see also inset legend). The n values used in the analysis are indicated below each group. Means comparisons were performed with unpaired student’s t-test. (H) Representative photos of heart slices stained with Evans blue and TTC at the end of 24 hrs of in vivo reperfusion (ischemic injury induced by 45 min. of LAD occlusion and reopening in vivo). (I) Area percentages (%) for the two experimental groups. Bars show the mean and whiskers cover the SEM (1.5 coeff.). Unpaired t-tests assuming unequal variance were applied within each category to evaluate differences in means between Ctrl and CKO and P values are indicated. N=9 Ctrl and 8 CKO mice.

