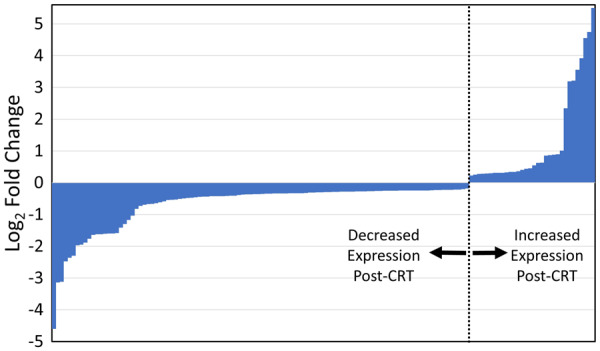
Figure 2.

Log2 fold changes of genes with significant paired differences in PBMC expression post-CRT. This graphic displays the log2 fold changes for the 138 genes with significant (FDR < 0.05) paired differences in PBMC expression post-CRT relative to pre-CRT expression based on RNA-Seq in the 12 patients with CRT. The actual FDRs and a full list of the genes are shown in the Supplementary material online, Supplementary Table. CRT, cardiac resynchronization therapy; FDR, false discovery rate; RNA-Seq, RNA sequencing.
