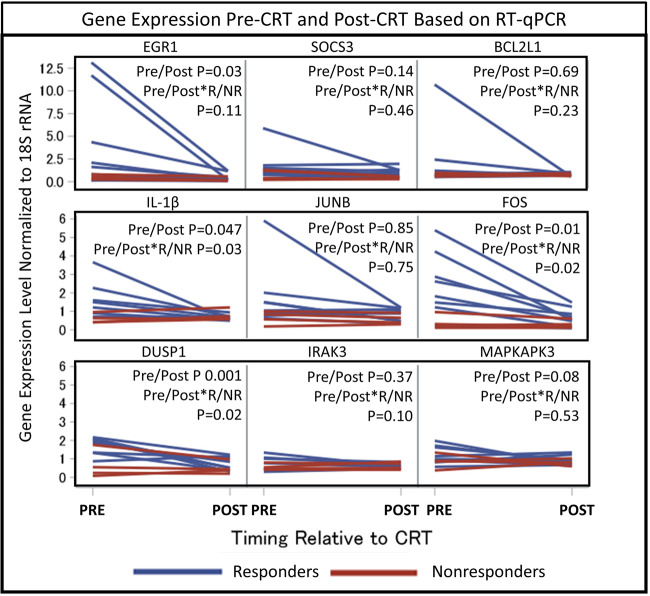
Figure 4.
Gene expression pre-CRT and post-CRT based on RT-qPCR. Measured gene expression levels normalized to 18S rRNA based on RT-qPCR in the 12 CRT patients are shown for the following genes: IL-1β, FOS, DUSP1, JUNB, SOCS3, IRAK3, EGR1, BCL2L1, and MAPKAPK3. Blue lines indicate CRT responders (R), while red lines indicate non-responders (NR). P-values were determined using linear mixed effect models, which account for the timing of the measurement (pre-CRT vs. post-CRT), the patient’s responder status (as a binary variable), the interaction between the timing of the measurement and the responder status, and replicates of each measurement. BCL2L1, BCL2-like 1; CRT, cardiac resynchronization therapy; DUSP1, dual specificity phosphatase 1; EGR1, early growth response 1; FOS, Fos proto-oncogene; IL-1β, interleukin-1β; IRAK3, interleukin 1 receptor associated kinase 3; JUNB, JunB proto-oncogene; MAPKAPK3, MAP-kinase activated protein kinase 3; RT-qPCR, quantitative real-time polymerase chain reaction; SOCS3, suppressor of cytokine signalling 3.

