Fig. 1.
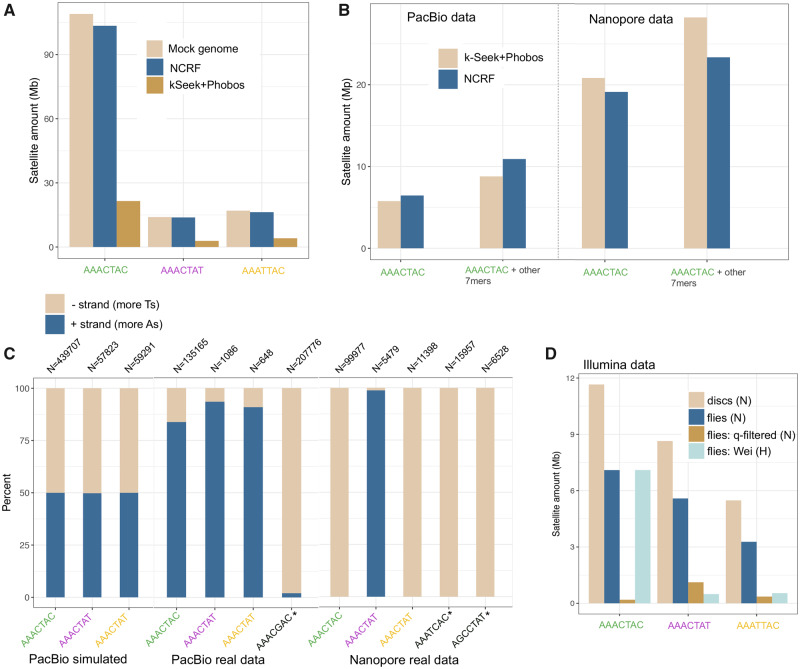
Issues in quantifying simple satellites in sequencing data (all data shown are Drosophila virilis). (A) Cumulative stacked barplot comparing the performance of the two tested approaches on PacBio data simulated with PBSim from a mock genome. (B) Comparing the results of the two approaches on the PacBio and Nanopore data; “other” refers to additional satellites in the family, including suspected artifactual ones (AAAGCAC for PacBio and AAATCAC + AGCCTAT for Nanopore). (C) Strand biases in the sequenced satellites in long-read sequencing data. Satellites with asterisks are suspected artifactual ones. N refers to the number of read fragments used for the calculation. (D) Amount of satellites quantified in Illumina data sets: imaginal discs (pure diploid), compared with flies (some polyteny), fly data that has been quality filtered (this study), and fly data from a previous study by Wei et al. (2018). N indicates NextSeq platform and H indicates HiSeq platform.

