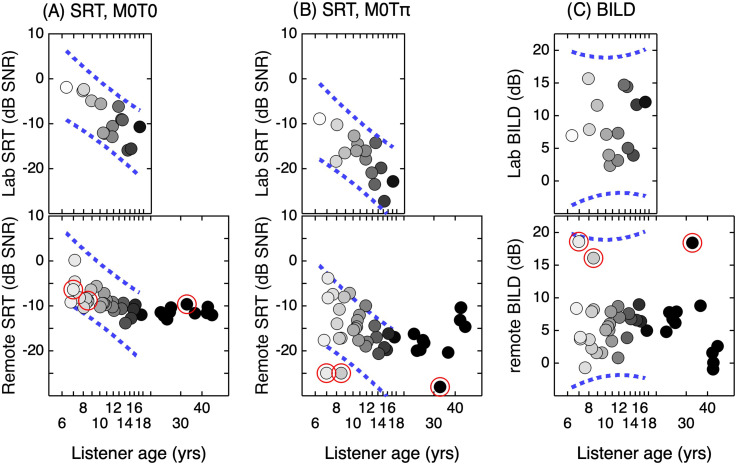
Fig. 1.
Results for laboratory testing (top row) and Day 1 of remote testing (bottom row), shown separately for SRTs in the M0T0 condition (column A), SRTs in the M0Tπ condition (column B), and BILD (column C). Data are plotted as a function of listener age, which is also represented with symbol shading. Dotted lines indicate the 95% prediction interval for the line fit to laboratory data as a function of child age. Remote data for three listeners are highlighted with circles. These listeners were a parent and two children from the same family, all of whom listened using the same hardware; all three had unusually low SRTs in the M0Tπ condition compared to other listeners, and as a result, unusually high BILDs.

