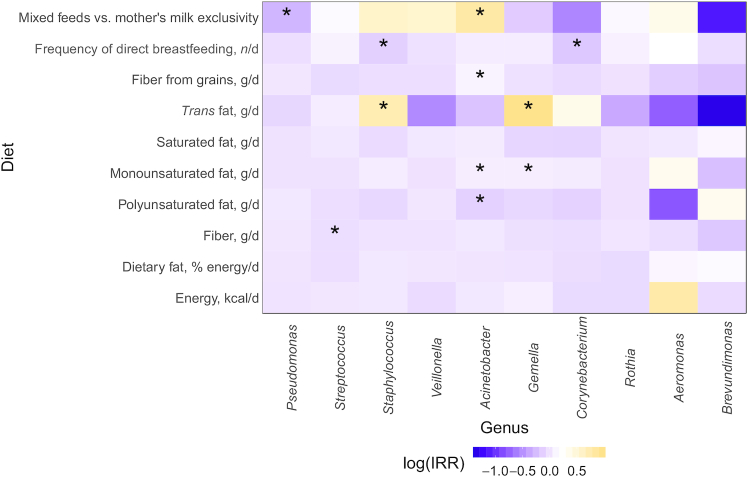
FIGURE 4.
Differential abundance of the 10 most abundant microbiota genera in human milk at 3 mo postpartum based on maternal diet and infant feeding practices. Heatmaps represent the results from multivariable Poisson regression models (PROC GENMOD; SAS Institute) with the top 10 genera as the outcome variables; the colored boxes refer to the IRR on a log scale, whereas asterisks refer to statistically significant results (*P ≤ 0.017). IRR, incidence rate ratio.

