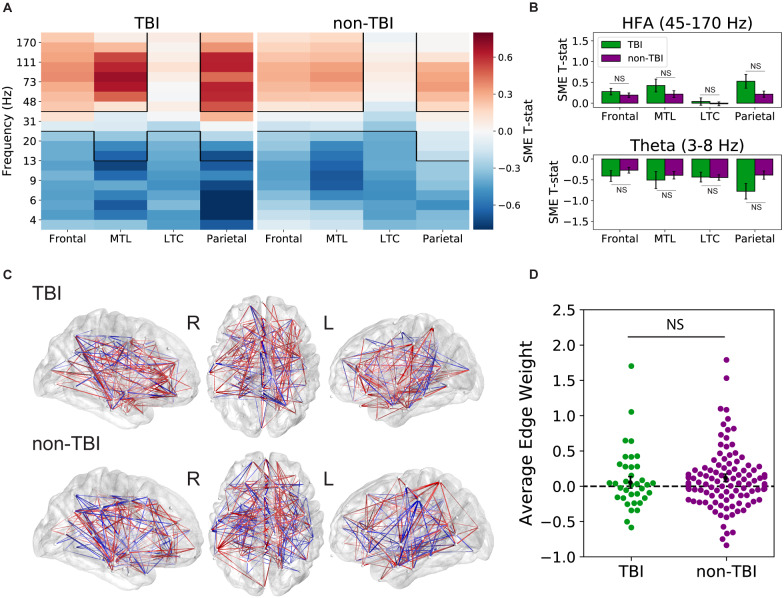
Figure 2.
Biomarkers of successful memory encoding. (A) Average spectral power SME t-statistics (recalled versus non-recalled encoding periods) at 20 frequencies spanning 3–170 Hz and four distinct brain regions [frontal lobe, medial temporal lobe (MTL), lateral temporal cortex (LTC) and parietal lobe]. Both groups exhibit a significant increase in high-frequency activity (HFA), a significant decrease in low frequency activity during successful encoding [P < 0.05] (B) and statistically similar power SME in every ROI (P > 0.1). (C) Group average theta encoding networks overlaid on an average brain surface. Each node represents a distinct ROI. Connections (edges) between nodes are coloured red when theta synchronization increases during successful memory encoding and blue where synchronization decreases during encoding. (D) Average synchronization Z-score (‘edge weight’) distributions, with positive values reflecting overall memory-related synchronization. Across subjects, we found a significant increase in theta synchronization with successful memory encoding for the non-TBI group [t(110) = 2.20, P = 0.03] but not for the TBI group [t(36) = 0.66, P = 0.51]; there was no evidence of a difference between the two groups [t(146) = −0.65, P = 0.52]

