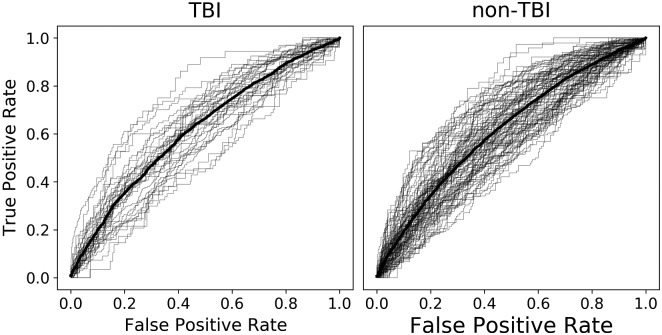
Figure 3.
Classifier performance. For each unique subject, receiver operating characteristic curves show the performance of a logistic-regression classifier tested on held-out sessions of the delayed free-recall task (grey lines), with the group average performance shown in bold (TBI group, left: mean AUC = 0.624, n = 37, SEM = 0.011; non-TBI group, right: mean AUC = 0.620, n = 111, SEM = 0.008). The distributions of the two groups were statistically equivalent [t(142) = 0.29, P = 0.77]

