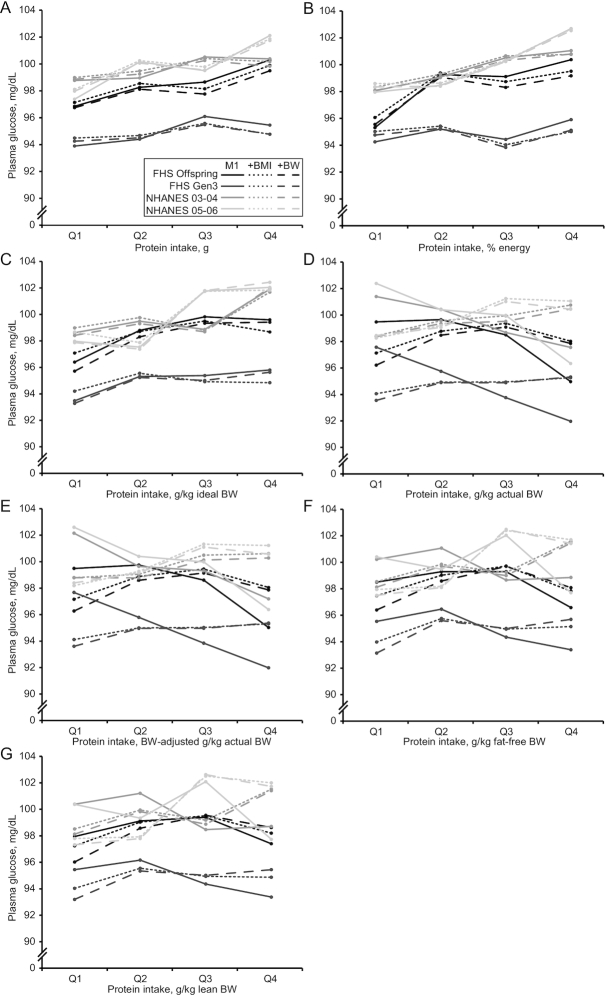
FIGURE 1.
Associations between protein intake, expressed in quartile categories of various units, and fasting plasma glucose (mg/dL) in 4 cohorts: FHS Offspring, FHS Gen3, NHANES 2003–04, and NHANES 2005–06. Points represent least square adjusted means of plasma glucose in each quartile category of intake, adjusted for age, sex, and energy intake (solid line), and additionally adjusted for BMI (dotted line) or BW (dashed line). Daily intake units are grams (A), percent energy (B), g/kg ideal BW (C), g/kg actual BW (D), BW-adjusted g/kg actual BW (E), g/kg fat-free BW (F), and g/kg lean BW (G). Participant numbers in quartile categories of intake (Q1 through Q4) are as follows: FHS Offspring: 461, 462, 462, and 462; FHS Gen3: 637, 637, 637, and 637; NHANES 2003–04: 406, 406, 407, and 406; and NHANES 2005–06: 336, 337, 337, and 337. Abbreviations: BW, body weight; FHS, Framingham Heart Study; Gen3, FHS Third Generation cohort; M1, model 1.

