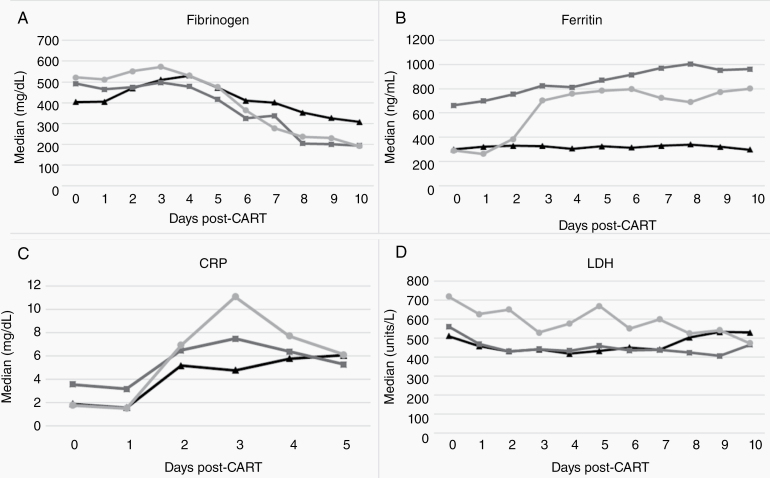
Fig. 3.
Median values for select correlative biomarker values and trends post CAR-T infusion: (A) fibrinogen (days 0–10), (B) ferritin (days 0–10), (C) CRP (days 0–5), (D) LDH (days 0–10).
Per legend: triangle markers (black line) represent patients with no ICANS; square markers (dark gray line) represent patients with grade 1–2 ICANS; circle markers (light gray line) represent patients with severe, or grade 3–4 ICANS.

