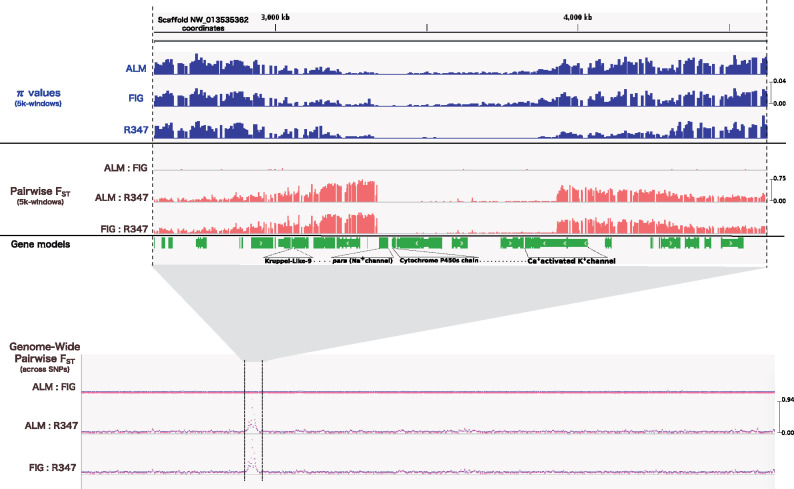
Fig. 2.
Selective sweep region in scaffold NW_013535362.1 of the Amyelois transitella genome. Top to bottom: Top panel shows π values in the sweep and its flanking regions calculated across 5-kb windows in bifenthrin-susceptible (ALM and FIG), and resistant (R347) populations. Middle panel shows pairwise FST estimates calculated in the sweep and its flanking regions across 5-kb windows for the three populations pairs. Bottom panel shows the “genome-wide” pairwise FST values calculated across SNPs, red and blue overlapped lines are results from Popoolation2 (Kofler, Pandey, et al. 2011) and “Poolfstat” v.1.0.0 R package https://cran.r-project.org/web/packages/poolfstat, respectively.

