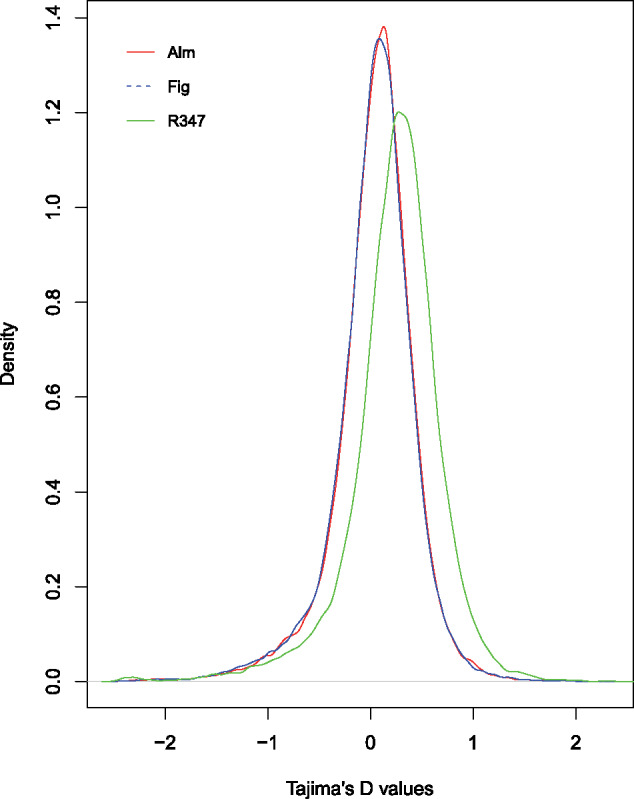
Fig. 3.

Distribution of Tajima’s D values across three populations of Amyelois transitella. Values were calculated on 5-kb non-overlapping windows across the full genome. The curves show heavy tails on both positive and negative values. Negative Tajima’s D suggests an excess of low-frequency mutations that could be due to population expansion, background selection, or selective sweeps, whereas positive Tajima’s D indicates balancing selection.
